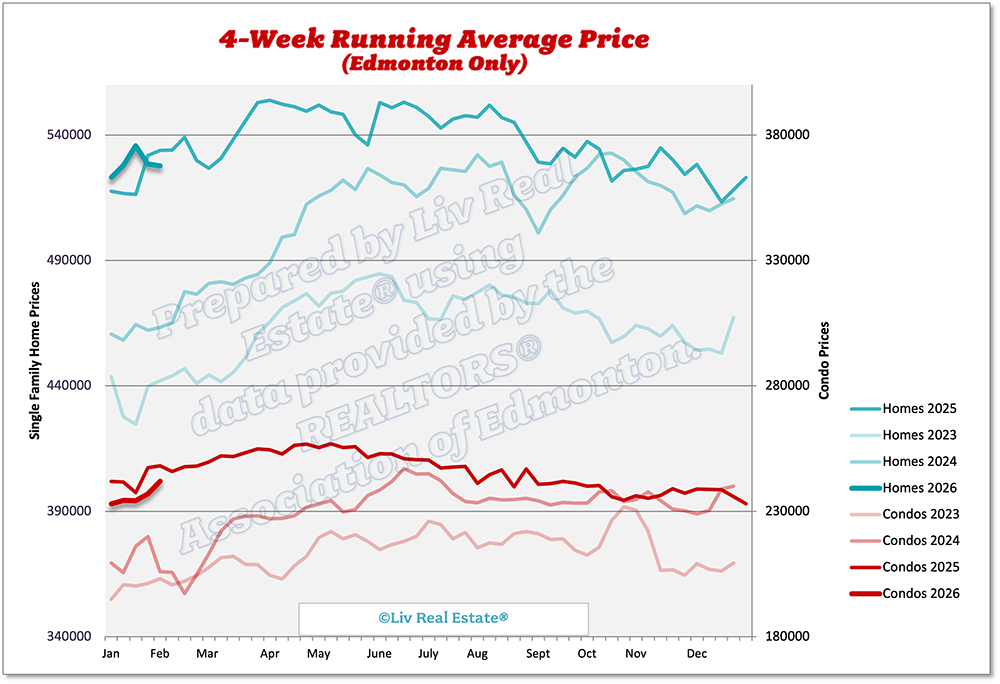
Here is our weekly update on the Edmonton real estate market for the past 7 days: (Previous week's numbers are in brackets). 

New Listings: 534 (589, 587, 450)
Sales: 314 (305, 271, 208)
Ratio: 58% (52%, 46%, 46%)
Price Changes: 172 (174, 202, 171)
Expired/Off-Market Listings: 180 (194, 348, 169)
Net loss/gain in listings this week: 49 (90, -32, 73)
Active single-family home listings: 2133 (2075, 2015, 2027)
Active condo listings: 1495 (1446, 1395, 1400)
Homes 4-week running average: $544 ($531, $517, $528)
Condos 4-week running average: $254 ($247, $243, $242)

425 Views, 0 Comments
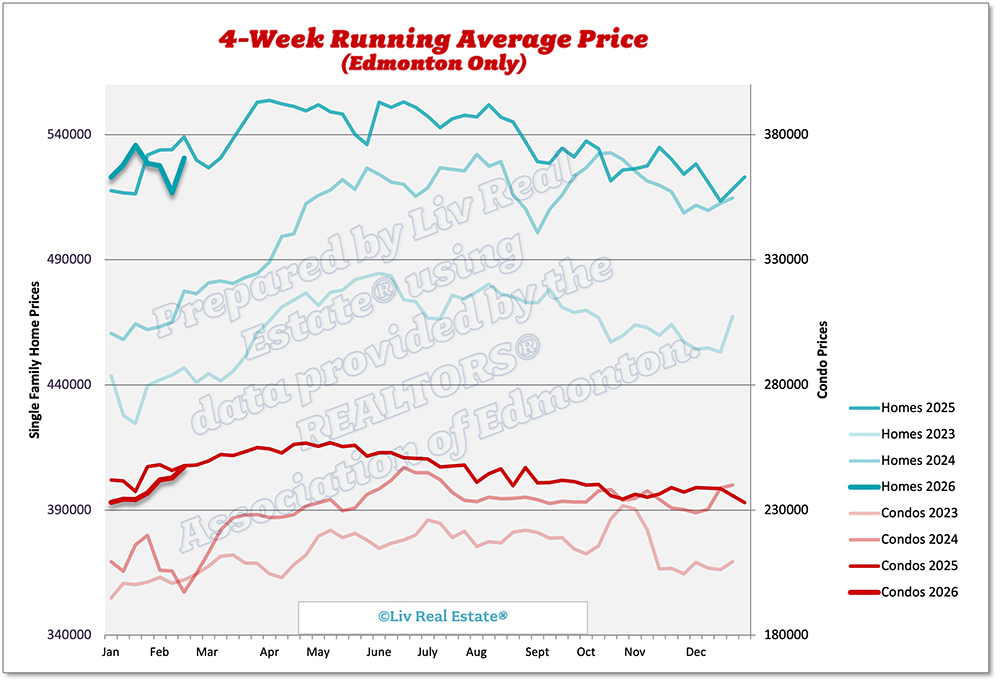
Here is our weekly update on the Edmonton real estate market for the past 7 days: (Previous week's numbers are in brackets). 

New Listings: 589 (587, 450, 380)
Sales: 305 (271, 208, 212)
Ratio: 52% (46%, 46%, 56%)
Price Changes: 174 (202, 171, 286)
Expired/Off-Market Listings: 194 (348, 169, 170)
Net loss/gain in listings this week: 90 (-32, 73, -2)
Active single-family home listings: 2075 (2015, 2027, 1970)
Active condo listings: 1446 (1395, 1400, 1401)
Homes 4-week running average: $531 ($517, $528, $528)
Condos 4-week running average: $247 ($243, $242, $237)

407 Views, 0 Comments

Here is our weekly update on the Edmonton real estate market for the past 7 days: (Previous week's numbers are in brackets). 

New Listings: 587 (450, 380, 449)
Sales: 271 (208, 212, 209)
Ratio: 46% (46%, 56%, 47%)
Price Changes: 202 (171, 286, 144)
Expired/Off-Market Listings: 348 (169, 170, 193)
Net loss/gain in listings this week: -32 (73, -2, 47)
Active single-family home listings: 2015 (2027, 1970, 2016)
Active condo listings: 1395 (1400, 1401, 1352)
Homes 4-week running average: $517 ($528, $528, $536)
Condos 4-week running average: $243 ($242, $237, $234)

318 Views, 0 Comments

The Greater Edmonton real estate market began 2026 with a clear moderation in activity compared to the unusually strong start to 2025. January recorded 1,151 residential sales, down 28 % year over year, while new listings increased modestly to 2,512, up 5 % from January 2025. This shift pushed the sales-to-new-listings ratio down to 46 %, from 66 % a year earlier, signalling a move toward more balanced market conditions.

Despite softer sales, prices rose modestly. The average residential sale price reached $448,761, up 2.5 % year over year, while the median price rose to $430,000, a 3.0 % increase. With a 3 % increase in new listings, inventory levels increased significantly. Active residential listings at month-end rose to 4,881 units, up 32 % from…

1276 Views, 0 Comments

Here is our weekly update on the Edmonton real estate market for the past 7 days: (Previous week's numbers are in brackets). 

New Listings: 450 (380, 449, 443)
Sales: 208 (212, 209, 182)
Ratio: 46% (56%, 47%, 41%)
Price Changes: 171 (286, 144, 188)
Expired/Off-Market Listings: 169 (170, 193, 194)
Net loss/gain in listings this week: 73 (-2, 47, 67)
Active single-family home listings: 2027 (1970, 2016, 1979)
Active condo listings: 1400 (1401, 1352, 1319)
Homes 4-week running average: $528 ($528, $536, $528)
Condos 4-week running average: $242 ($237, $234, $234)

314 Views, 0 Comments

The REALTORS® Association of Edmonton recently held its annual housing forecast, giving us insights into what to expect in the Greater Edmonton area housing market in 2026. The consensus for the day was that Edmonton’s real estate market is entering a new phase — one defined less by rapid price acceleration and more by steady demand, balanced conditions, and the supportive backdrop of Alberta’s broader economic trends.

Troy Paquette, the Association's Chair-Elect, started the day off by looking back at 2025, which marked a year of recalibration for the Greater Edmonton real estate market. Activity cooled from the extraordinary highs of the post-pandemic period as migration slowed, inventory began to rise, and economic uncertainty tempered buyer demand.…

3512 Views, 0 Comments

Here is our weekly update on the Edmonton real estate market for the past 7 days: (Previous week's numbers are in brackets). 

New Listings: 380 (449, 443, 157)
Sales: 212 (209, 182, 116)
Ratio: 56% (47%, 41%, 74%)
Price Changes: 286 (144, 188, 58)
Expired/Off-Market Listings: 170 (193, 194, 504)
Net loss/gain in listings this week: -2 (47, 67, -463)
Active single-family home listings: 1970 (2016, 1979, 1901)
Active condo listings: 1401 (1352, 1319, 1289)
Homes 4-week running average: $528 ($536, $528, $523)
Condos 4-week running average: $237 ($234, $234, $233)

311 Views, 0 Comments

Here is our weekly update on the Edmonton real estate market for the past 7 days: (Previous week's numbers are in brackets). 

New Listings: 449 (443, 157, 229)
Sales: 209 (182, 116, 244)
Ratio: 47% (41%, 74%, 107%)
Price Changes: 144 (188, 58, 211)
Expired/Off-Market Listings: 193 (194, 504, 227)
Net loss/gain in listings this week: 47 (67, -463, -242)
Active single-family home listings: 2016 (1979, 1901, 2288)
Active condo listings: 1352 (1319, 1289, 1516)
Homes 4-week running average: $536 ($528, $523, $513)
Condos 4-week running average: $234 ($234, $233, $239)

325 Views, 0 Comments

Here is our weekly update on the Edmonton real estate market for the past 7 days: (Previous week's numbers are in brackets). 

New Listings: 443 (157, 229, 345)
Sales: 182 (116, 244, 256)
Ratio: 41% (74%, 107%, 74%)
Price Changes: 188 (58, 211, 219)
Expired/Off-Market Listings: 194 (504, 227, 425)
Net loss/gain in listings this week: 67 (-463, -242, -336)
Active single-family home listings: 1979 (1901, 2288, 2464)
Active condo listings: 1319 (1289, 1516, 1601)
Homes 4-week running average: $528 ($523, $513, $528)
Condos 4-week running average: $234 ($233, $239, $239)

321 Views, 0 Comments

The Greater Edmonton real estate market closed 2025 from a position of strength, even as conditions began to normalize. A total of 26,835 homes sold in the Edmonton area in 2025, down 6% from 2024 but still above levels seen in 2021 through 2023. With a total of 39,381 listings, an 8% year-over-year increase, buyers had more to choose from in 2025. Despite this, inventory remained below long-term norms for much of the year, sustaining seller-favourable conditions across most property types.

Prices continued to advance at a measured but healthy pace. The annual average single-family home price rose 6.4% to $570,045, while townhouses increased 4.8% to $304,553 and apartment condominiums gained 5.5% to $211,388. These gains reflect ongoing demand pressure…

1868 Views, 0 Comments