It's no secret that buying a home in a seller’s market can be extra challenging, but fear not! We’re sharing our top tips so you'll be well-equipped to conquer this exciting but challenging journey. Let's dive in!

1. Work with an Experienced Real Estate Agent

In a competitive market, having an experienced real estate agent by your side is a game-changer. They have the inside track to new listings, can quickly schedule showings, and, most importantly, help you craft a winning offer. Their expertise and negotiation skills will give you the edge in this challenging environment. So, choose an agent who's well-versed in the local market and understands your unique needs.

2. Be Prepared with Financing

In a seller’s market, time is of the essence,…

7 Views, 0 Comments

Here is our weekly update on the Edmonton real estate market. (Previous week's numbers are in brackets). For the past 7 days:

New Listings: 556 (568, 541, 536)
Sales: 488 (419, 488, 435)
Ratio: 88% (74%, 90%, 81%)
Price Changes: 211 (184, 171, 185)
Expired/Off-Market Listings: 100 (141, 90, 111)
Net loss/gain in listings this week: -32 (8, -37, -10)
Active single-family home listings: 1997 (1959, 1925, 1845)
Active condo listings: 1241 (1208, 1175, 1159)
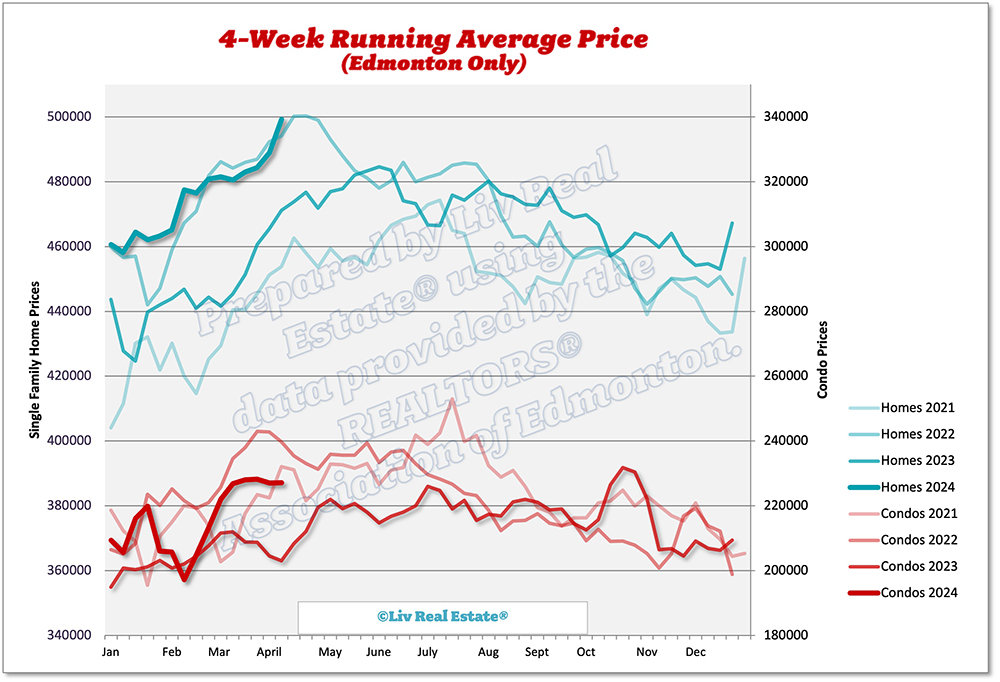
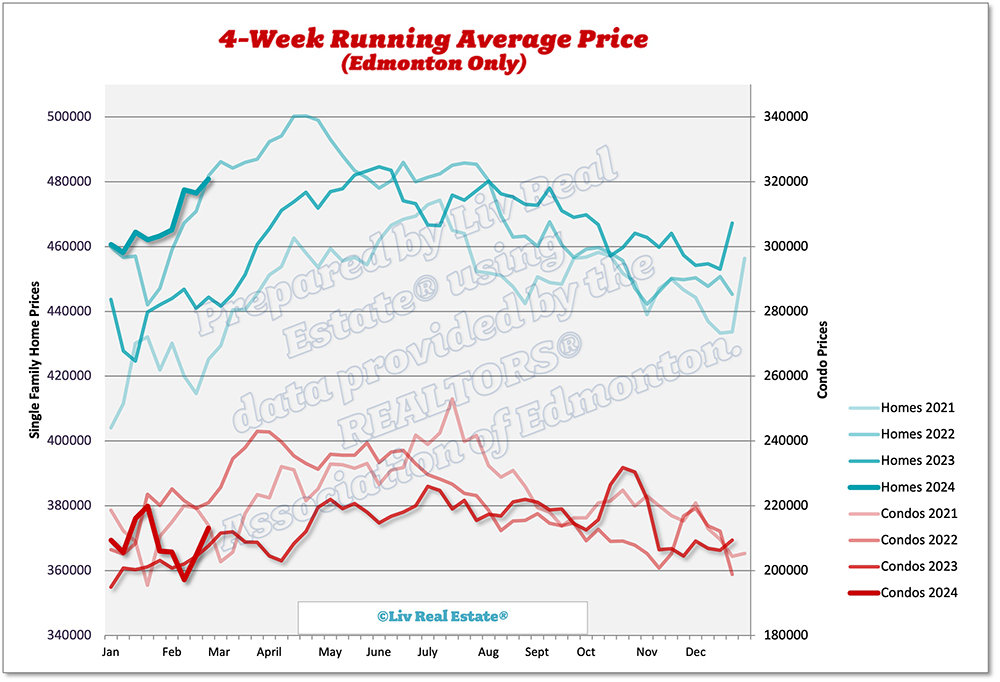
Homes 4-week running average: $499 ($489, $484, $483)
Condos 4-week running average: $227 ($227, $228, $228)

236 Views, 0 Comments

Here is our weekly update on the Edmonton real estate market. (Previous week's numbers are in brackets). For the past 7 days:

New Listings: 568 (541, 536, 557)
Sales: 419 (488, 435, 475)
Ratio: 74% (90%, 81%, 85%)
Price Changes: 184 (171, 185, 196)
Expired/Off-Market Listings: 141 (90, 111, 110)
Net loss/gain in listings this week: 8 (-37, -10, -28)
Active single-family home listings: 1959 (1925, 1845, 1829)
Active condo listings: 1208 (1175, 1159, 1125)
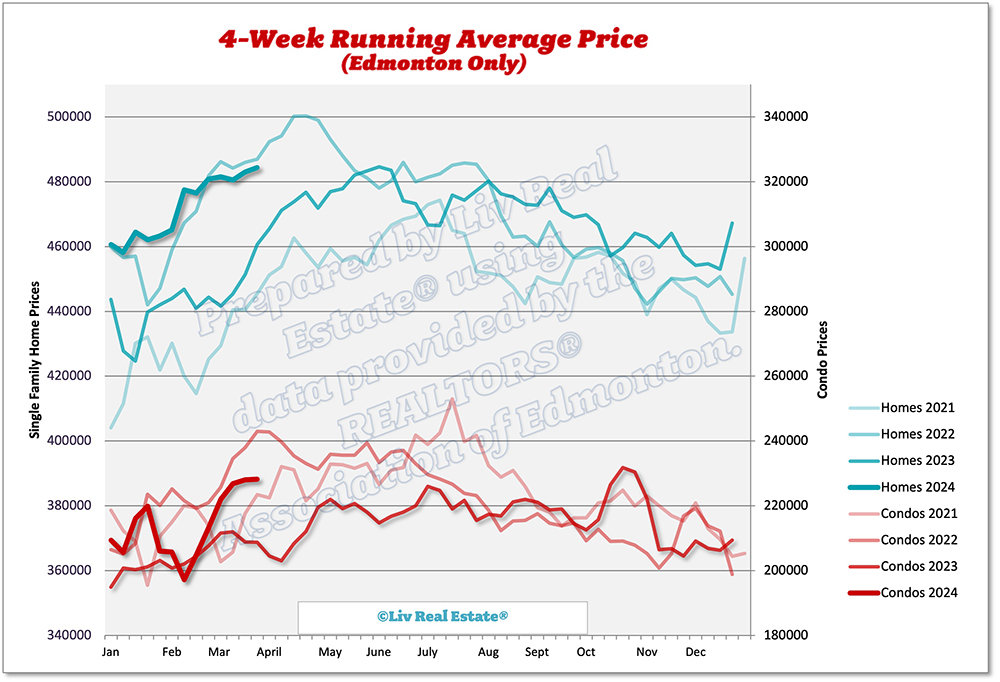
Homes 4-week running average: $489 ($484, $483, $481)
Condos 4-week running average: $227 ($228, $228, $227)

274 Views, 0 Comments

In March 2024, the Greater Edmonton real estate market offered a favourable landscape for sellers and attracted the interest of investors from other markets. Let's examine the latest trends, challenges, and opportunities that define the market.

March witnessed a remarkable 35% increase in sales compared to the previous year, with 2,467 transactions. The surge in sales activity reflects the relative affordability of the Edmonton area compared to other large cities across Canada.

New listings rose 8% from last year, which is a healthy influx of properties. However, strong demand led to a 16% decrease in inventory; the month ended with 5,315 listings - only 2.15 months of supply - and a strong seller's market.

For over a year, the Edmonton real…

1247 Views, 0 Comments

Here is our weekly update on the Edmonton real estate market. (Previous week's numbers are in brackets). For the past 7 days:

New Listings: 541 (536, 557, 570)
Sales: 488 (435, 475 ,483)
Ratio: 90% (81%, 85%, 85%)
Price Changes: 171 (185, 196, 173)
Expired/Off-Market Listings: 90 (111, 110, 160)
Net loss/gain in listings this week: -37 (-10, -28 , -73)
Active single-family home listings: 1925 (1845, 1829, 1750)
Active condo listings: 1175 (1159, 1125, 1127)
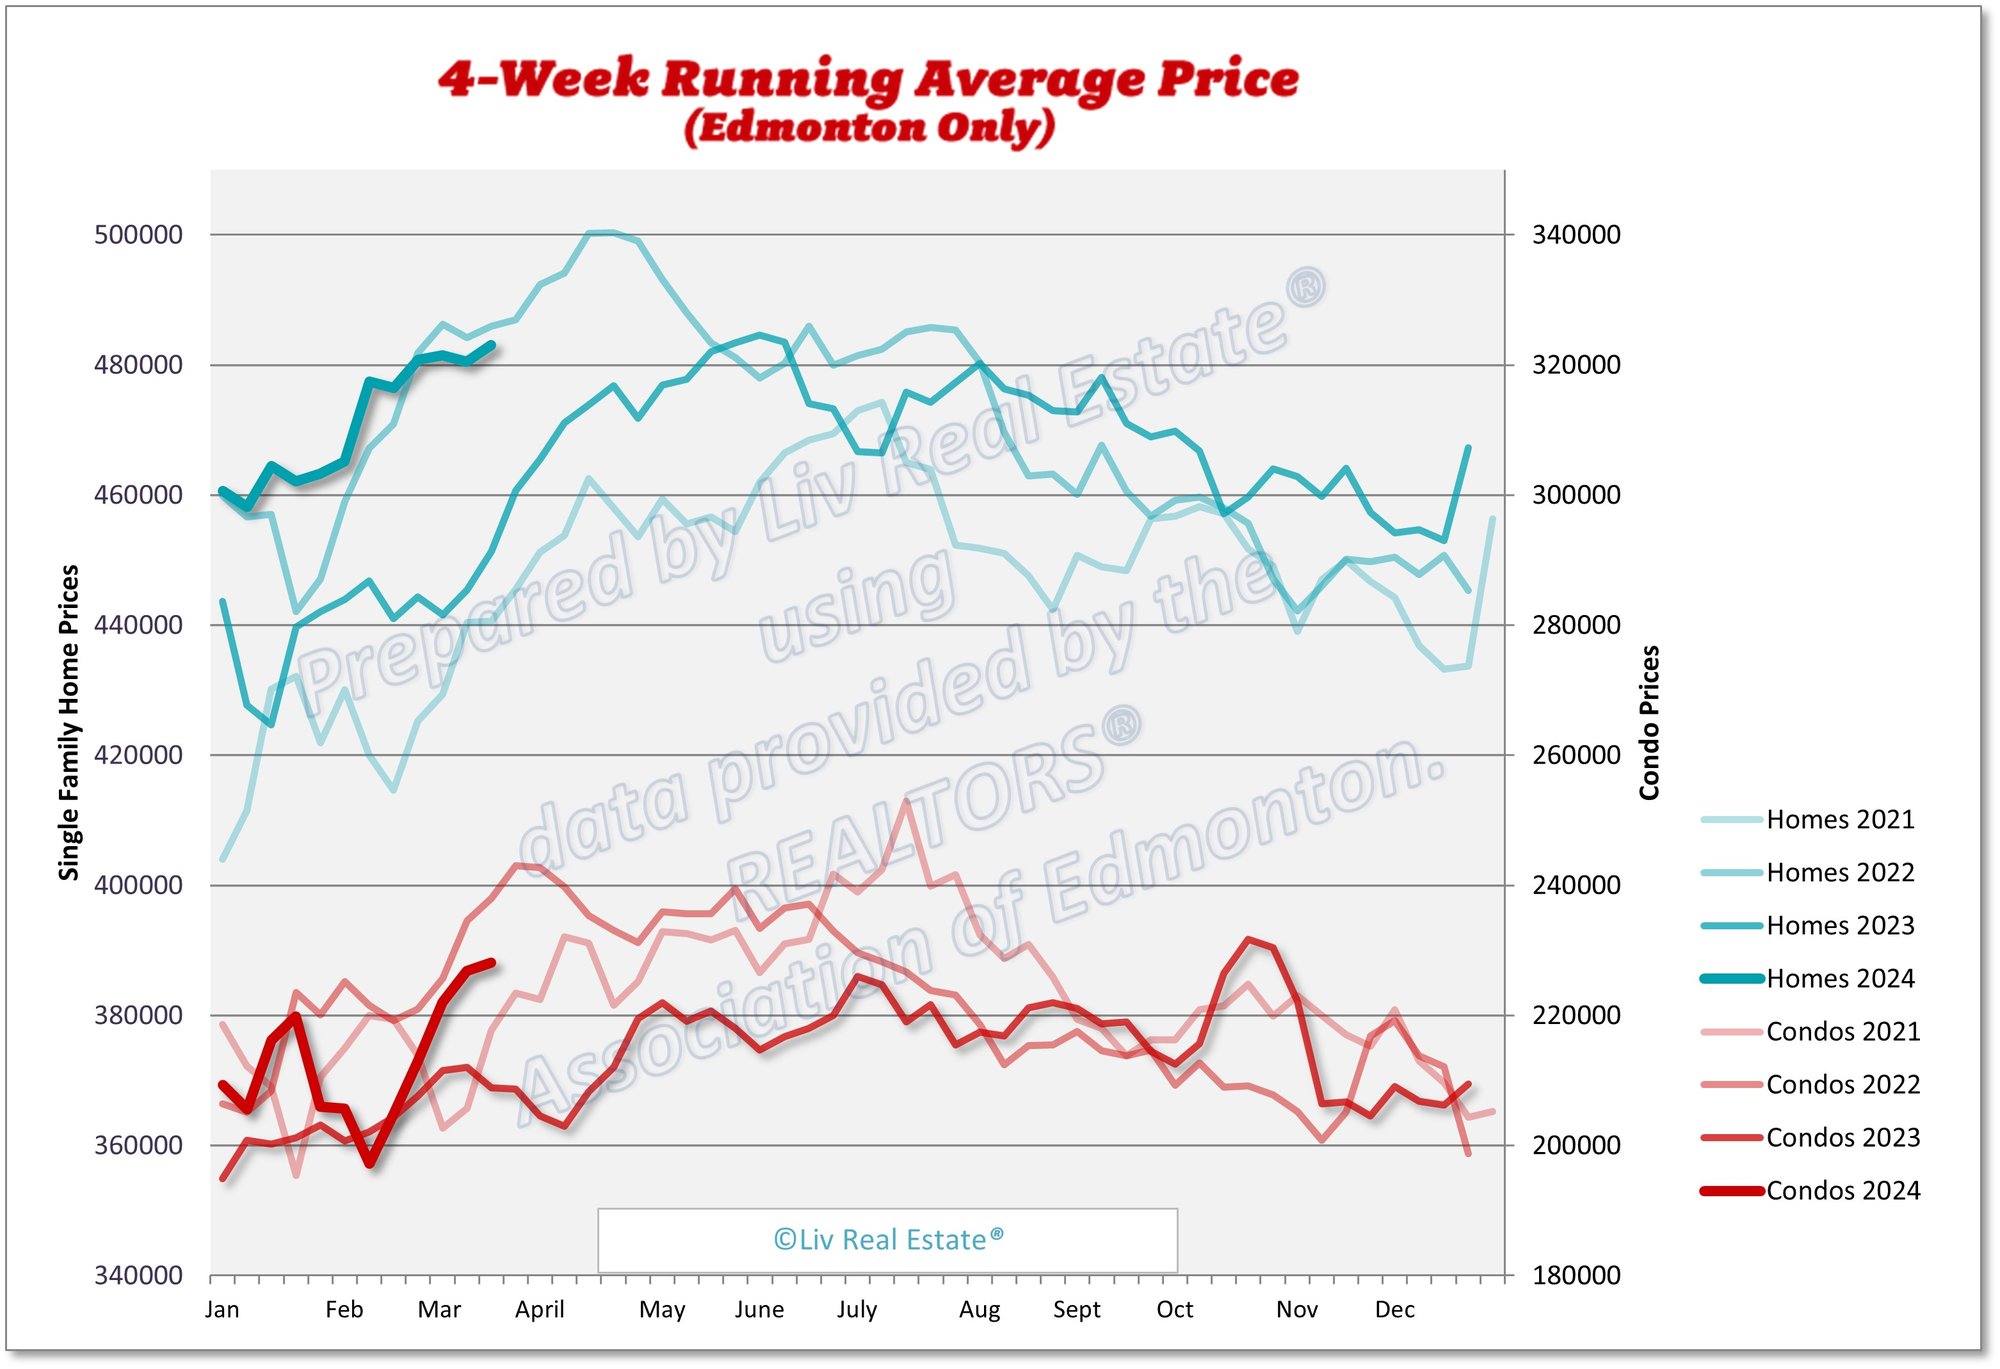
Homes 4-week running average: $484 ($483, $481, $482)
Condos 4-week running average: $228 ($228, $227, $222)

336 Views, 0 Comments

Here is our weekly update on the Edmonton real estate market. (Previous week's numbers are in brackets). For the past 7 days:

New Listings: 536 (557, 570, 447,)
Sales: 435 (475 ,483, 390)
Ratio: 81% (85%, 85%, 87%)
Price Changes: 185 (196, 173, 198)
Expired/Off-Market Listings: 111 (110, 160, 180)
Net loss/gain in listings this week: -10 (-28 , -73, -123)
Active single-family home listings: 1845 (1829, 1750, 1733)
Active condo listings: 1159 (1125, 1127, 1068)
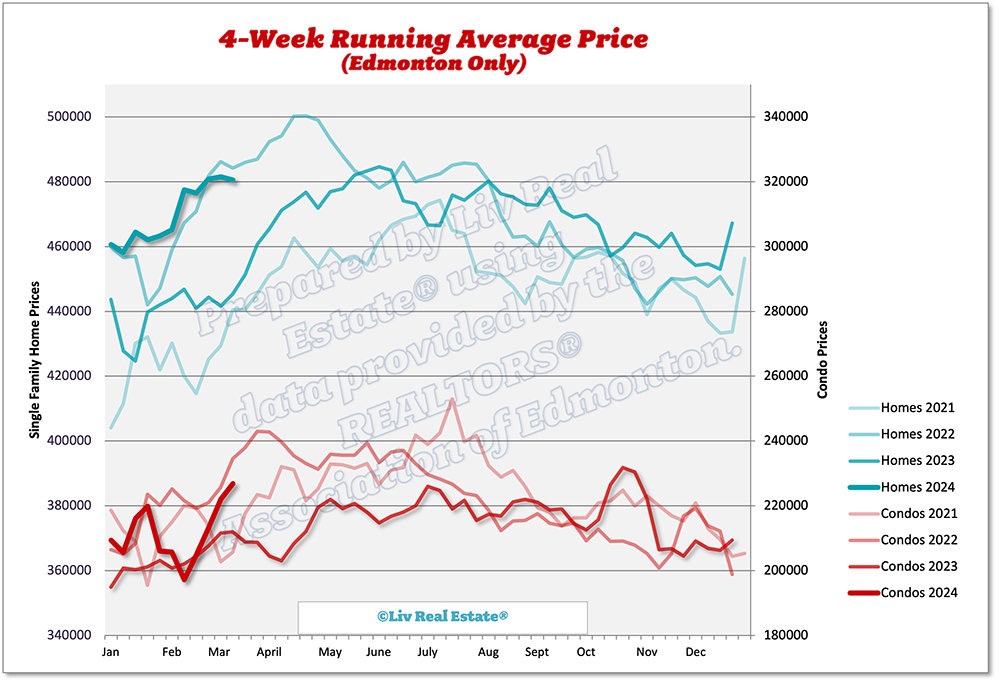
Homes 4-week running average: $483 ($481, $482, $481)
Condos 4-week running average: $228 ($227, $222, $213)

491 Views, 0 Comments

Here is our weekly update on the Edmonton real estate market. (Previous week's numbers are in brackets). For the past 7 days:

New Listings: 557 (570, 447, 434)
Sales: 475 (483, 390, 417)
Ratio: 85% (85%, 87%, 96%)
Price Changes: 196 (173, 198, 125)
Expired/Off-Market Listings: 110 (160, 180, 121)
Net loss/gain in listings this week: -28 (-73, -123, -104)
Active single-family home listings: 1829 (1750, 1733, 1747)
Active condo listings: 1125 (1127, 1068, 1065)
Homes 4-week running average: $481 ($482, $481, $476)
Condos 4-week running average: $227 ($222, $213, $205)


495 Views, 0 Comments

In February 2024, the Greater Edmonton real estate market experienced significant growth, hinting at an optimistic future for homeowners and investors. Sales soared by an impressive 52% compared to the previous year, totalling 1,966 transactions. Demand remained strong, leading to a decrease in inventory levels by 15% compared to the same period last year, with 4,802 listings at month-end. Despite a 7% increase in new listings, the market's competitive nature kept inventory well below normal levels.

This surge in sales activity can be attributed, in part, to the ongoing population growth in Alberta. As the population continues to rise, rental rates have increased, further motivating individuals to transition from renting to homeownership. This trend…

1274 Views, 1 Comments

Here is our weekly update on the Edmonton real estate market. (Previous week's numbers are in brackets). For the past 7 days:

New Listings: 570 (447, 434, 404)
Sales: 483 (390, 417, 368)
Ratio: 85% (87%, 96%, 91%)
Price Changes: 173 (198, 125, 132,)
Expired/Off-Market Listings: 160 (180, 121, 99)
Net loss/gain in listings this week: -73 (-123, -104, -63)
Active single-family home listings: 1750 (1733, 1747, 1757)
Active condo listings: 1127 (1068, 1065, 1065)
Homes 4-week running average: $482 ($481, $476, $477)
Condos 4-week running average: $222 ($213, $205, $197)

609 Views, 0 Comments

Here is our weekly update on the Edmonton real estate market. (Previous week's numbers are in brackets). For the past 7 days:

New Listings: 447 (434, 404, 424)
Sales: 390 (417, 368, 325)
Ratio: 87% (96%, 91%, 77%)
Price Changes: 198 (125, 132, 178)
Expired/Off-Market Listings: 180 (121, 99, 107)
Net loss/gain in listings this week: -123 (-104, -63, -8)
Active single-family home listings: 1733 (1747, 1757, 1771)
Active condo listings: 1068 (1065, 1065, 1059)
Homes 4-week running average: $481 ($476, $477, $465)
Condos 4-week running average: $213 ($205, $197, $206)

584 Views, 0 Comments