


 Posted by Liv Real Estate
on
Posted by Liv Real Estate
on
Enjoy this blog post? Click here to subscribe for updates
Posted by Liv Real Estate
on
Enjoy this blog post? Click here to subscribe for updates
8 Responses to Weekly Market Update Feb.19/21
Hi Sara,
Posted by T-Rev on Thursday, February 18th, 2021 at 8:39pmHow is the sold date for a property determined in your stats? Is it the day conditions are removed? Just trying to figure out the effect of the extreme cold on sales figures- I’m assuming fewer offers were made in minus 30, so allowing for an average of 7-14 days for conditions to come off, this would mean that we likely won’t see as many solds reported for the next 1-2 weeks even if activity picks up now the weather has gone back to normal.
Is that a correct assumption?
Hey,
Posted by Sara MacLennan on Thursday, February 18th, 2021 at 9:33pmYes, that is a correct assumption. A listing is reported sold when all conditions are removed. The number of showings slowed down during the deep freeze, however, buyers that are out looking at -30 are typically pretty serious. It's hard to believe sales are so far ahead of the last few years.
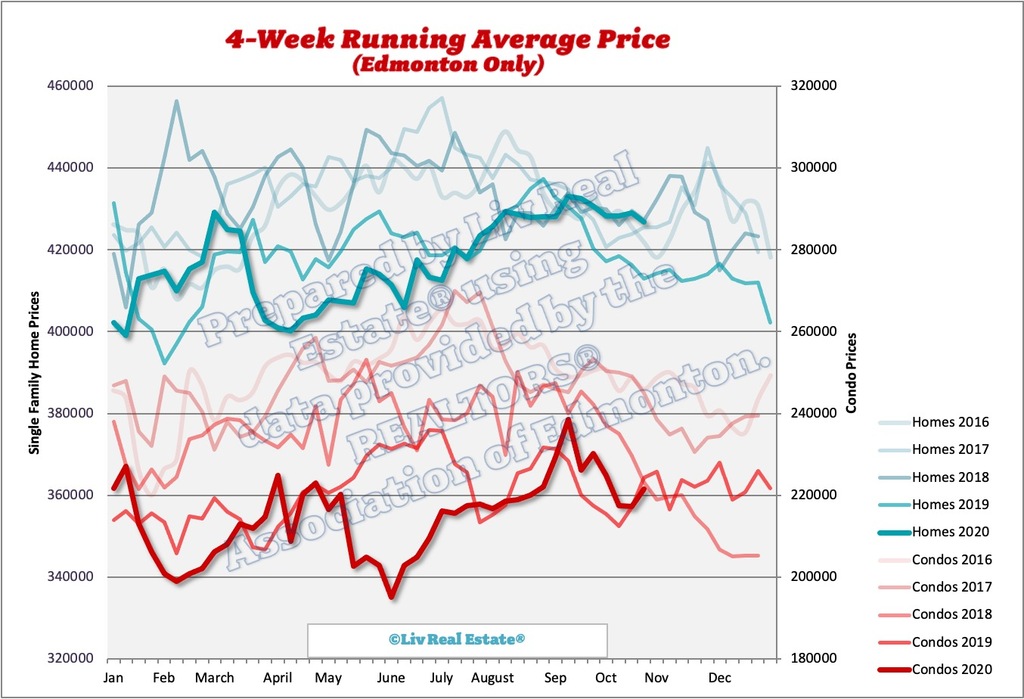
Liv, you posted the listings & sales graph twice, and didn't post the average sale price graph.
Posted by Brandon on Thursday, February 18th, 2021 at 11:44pmSara the charts are the same.
Posted by GM on Friday, February 19th, 2021 at 8:41pmYou're missing the price chart.
Thanks for pointing that out and sorry... I've corrected it now.
Posted by Sara MacLennan on Friday, February 19th, 2021 at 9:10pmThanks for pointing that out and sorry... I've corrected it now.
Posted by Sara MacLennan on Friday, February 19th, 2021 at 9:10pmSFH prices down two weeks in a row.
Posted by GM on Monday, February 22nd, 2021 at 5:37amWhat the heck...?
Everywhere else in the country prices are skyrocketing
https://www.creb.com/Housing_Statistics/Daily_Housing_Summary/
Posted by Renu Bhattacharya on Thursday, February 25th, 2021 at 4:17amIs there anything like this in Edmonton, that shows daily stats.
Leave A Comment