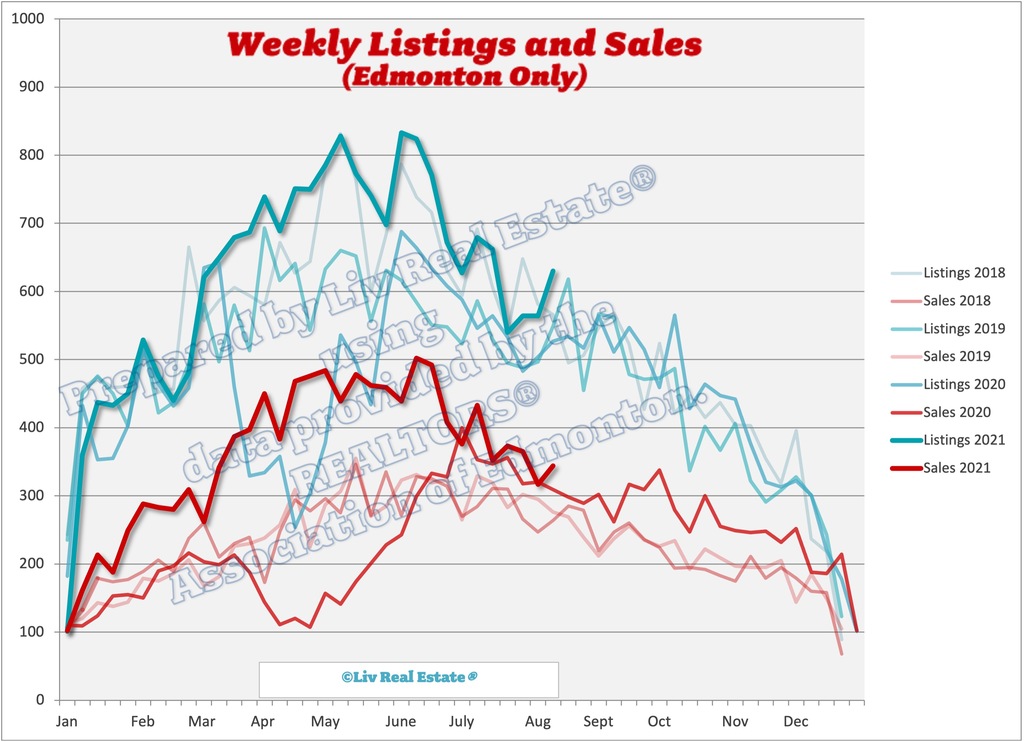
Weekly Market Update Aug.27/21
Posted by Liv Real Estate on
 Here is our update on the Edmonton real estate market. (Previous week’s numbers are in brackets). For the past 7 days:
New Listings: 548 (652, 630, 564)
# Sales: 335 (343, 344, 317)
Ratio: 61% (53%, 55%, 56%)
# Price Changes: 432 (367, 446, 446)
Expired/Off-Market Listings: 236 (277, 230, 470)
Net loss/gain in listings this week: -23 (32, 56, -223)
Active single-family home listings: 3390 (3399, 3355, 330)
Active condo listings: 2978 (2986, 2938, 2909)
Homes 4-week running average: $442 ($448, $451, $452)
Condos 4-week running average: $226 ($231, $229, $232)
372 Views, 5 Comments


 Here is our update on the Edmonton real estate market. (Previous week’s numbers are in brackets). For the past 7 days:
New Listings: 652 (630, 564, 564)
# Sales: 343 (344, 317, 365)
Ratio: 53% (55%, 56%, 65%)
# Price Changes: 367 (446, 446, 471)
Expired/Off-Market Listings: 277 (230, 470, 221)
Net loss/gain in listings this week: 32 (56, -223, -22)
Active single-family home listings: 3399 (3355, 3301, 3400)
Active condo listings: 2986 (2938, 2909, 3039)
Homes 4-week running average: $448 ($451, $452, $452)
Condos 4-week running average: $231 ($229, $232, $242)
 We recently gathered at Laurier Park for our first ever Summer Extravaganza Picnic and wow, was it ever a success! It was amazing to see everyone for a family-friendly picnic, where the team could gather and kids and dogs were all welcome. There were tons of activities set up for everyone to enjoy including bubbles, volleyball, soccer and more! We had drinks and snacks for all - even water dishes for our four-legged friends. Curbside YEG was on site serving up delicious eats and the guys from Frosted Shaved Ice brought the cool treats. We know this is an event we won’t forget! Especially with all the great photos, thanks to Rob with Rob Hislop Photography. He was so engaging and seamlessly blended into the event capturing incredible candid and action…

 Here is our update on the Edmonton real estate market. (Previous week’s numbers are in brackets). For the past 7 days:
New Listings: 564 (564, 540, 662)
# Sales: 317 (365, 373, 352)
Ratio: 56% (65%, 69%, 53%)
# Price Changes: 446 (471, 451, 468)
Expired/Off-Market Listings: 470 (221, 232, 240)
Net loss/gain in listings this week: -223 (-22, -65, 70)
Active single-family home listings: 3301 (3400, 3385, 3415)
Active condo listings: 2909 (3039, 3021, 3044)
Homes 4-week running average: $452 ($452, $464, $465)
Condos 4-week running average: $232 ($242, $240, $253)
 During one of the hottest months Edmonton has ever seen, the real estate market certainly cooled off in July. While it's normal for sales to drop from June to July, a 19% drop is bigger than normal, however, we did come down from an all-time high and sales were up 2% from last July. The drop is due at least in part to summer holidays - with travel options finally opening up a bit, many Edmontonians have hit the road and put house hunting on the back burner for now. The inventory of homes on the market increased 4% over last year and was basically the same as last month - we typically see the inventory start to decline in July. With 3.6 months of supply, we've almost edged back into a balanced market, bringing some much-needed relief to buyers that have…