Here is our update on the Edmonton real estate market. (Previous week’s numbers are in brackets). For the past 7 days:

New Listings: 603 (649, 661, 633)
Sales: 420 (493, 422, 434)
Ratio: 70% (76%, 64%, 69%)
Price Changes: 390 (395, 351, 373)
Expired/Off-Market Listings: 174 (194, 202, 308)
Net loss/gain in listings this week: 9 (-38, 37, -109)
Active single-family home listings: 2940 (2901, 2839, 2791)
Active condo listings: 1841 (1836, 1795, 1747)
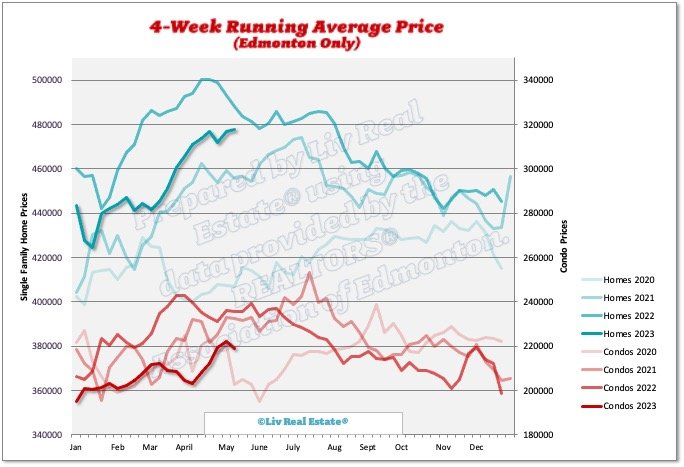
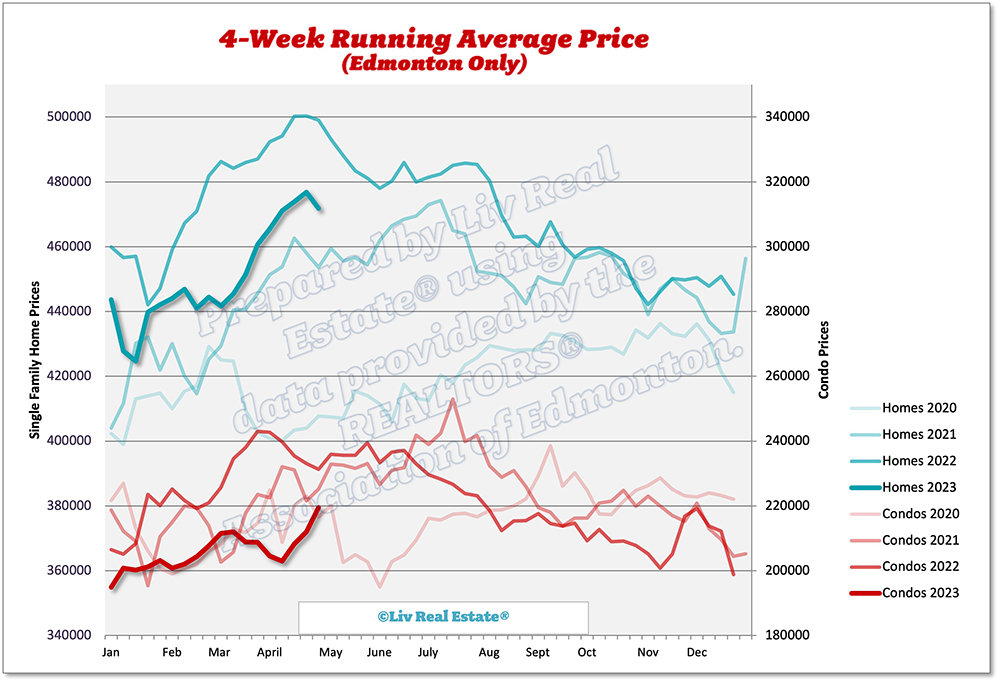
Homes 4-week running average: $482 ($478, $477, $472)
Condos 4-week running average: $221 ($219, $222, $220)


519 Views, 1 Comments

Here is our update on the Edmonton real estate market. (Previous week’s numbers are in brackets). For the past 7 days:

New Listings: 649 (661, 633, 580)
Sales: 493 (422, 434, 396)
Ratio: 76% (64%, 69%, 68%)
Price Changes: 395 (351, 373, 345)
Expired/Off-Market Listings: 194 (202, 308, 155)
Net loss/gain in listings this week: -38 (37, -109, 29)
Active single-family home listings: 2901 (2839, 2791, 2859)
Active condo listings: 1836 (1795, 1747, 1744)
Homes 4-week running average: $478 ($477, $472, $477)
Condos 4-week running average: $219 ($222, $220, $212)

428 Views, 1 Comments

Here is our update on the Edmonton real estate market. (Previous week’s numbers are in brackets). For the past 7 days:

New Listings: 661 (633, 580, 696)
Sales: 422 (434, 396, 427)
Ratio: 64% (69%, 68%, 61%)
Price Changes: 351 (373, 345, 319)
Expired/Off-Market Listings: 202 (308, 155, 181)
Net loss/gain in listings this week: 37 (-109, 29, 88)
Active single-family home listings: 2839 (2791, 2859, 2820)
Active condo listings: 1795 (1747, 1744, 1721)
Homes 4-week running average: $477 ($472, $477, $474)
Condos 4-week running average: $222 ($220, $212, $208)

516 Views, 0 Comments

Here is our update on the Edmonton real estate market. (Previous week’s numbers are in brackets). For the past 7 days:

New Listings: 633 (580, 696, 590)
Sales: 434 (396, 427, 317)
Ratio: 69% (68%, 61%, 54%)
Price Changes: 373 (345, 319, 297)
Expired/Off-Market Listings: 308 (155, 181, 190)
Net loss/gain in listings this week: -109 (29, 88, 83)
Active single-family home listings: 2791 (2859, 2820, 2736)
Active condo listings: 1747 (1744, 1721, 1666)
Homes 4-week running average: $472 ($477, $474, $471)
Condos 4-week running average: $220 ($212, $208, $203)


573 Views, 0 Comments

Sales in the Greater Edmonton area are once again well below the levels seen during the pandemic but well ahead of pre-pandemic levels. If you don't include 2021 and 2022, there were more sales in April 2023 than there were in at least 15 years. The demand is a bit surprising when you consider interest rates are higher than we've seen in years. Lucky for us, we have plenty of new listings coming on the market, while in Calgary, inventory is extremely low, and prices have hit an all-time high. Our inventory is still below normal for this time of year, and for the second month in a row, we find ourselves in a seller's market with a 3.4-month supply of listings.


City of Edmonton Stats

969 Views, 0 Comments