Here is our update on the Edmonton real estate market. (Previous week’s numbers are in brackets). For the past 7 days:

New Listings: 572 (638, 720, 646)
Sales: 333 (372, 385, 309)
Ratio: 58% (58%, 53%, 48%)
Price Changes: 569 (571, 654, 521)
Expired/Off-Market Listings: 244 (239, 238, 437)
Net loss/gain in listings this week: -5 (27, 97, -100)
Active single-family home listings: 3687 (3636, 3545, 3420)
Active condo listings: 2536 (2533, 2495, 2447)
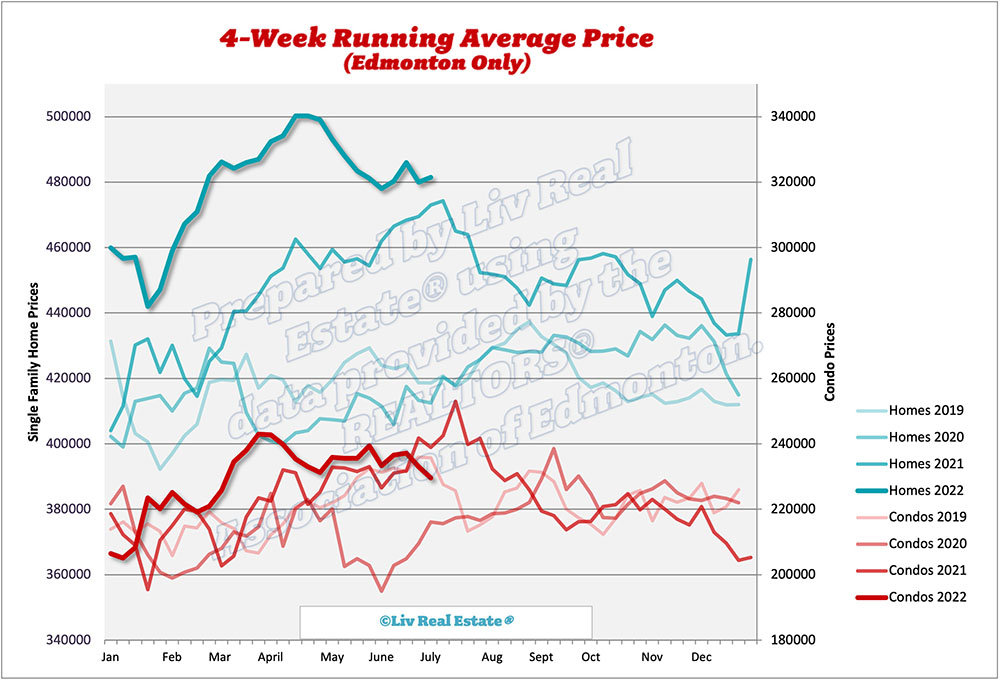
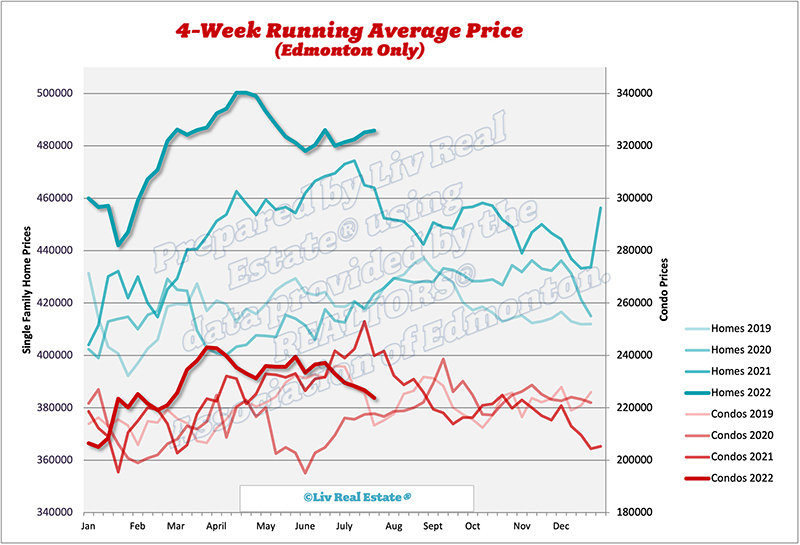
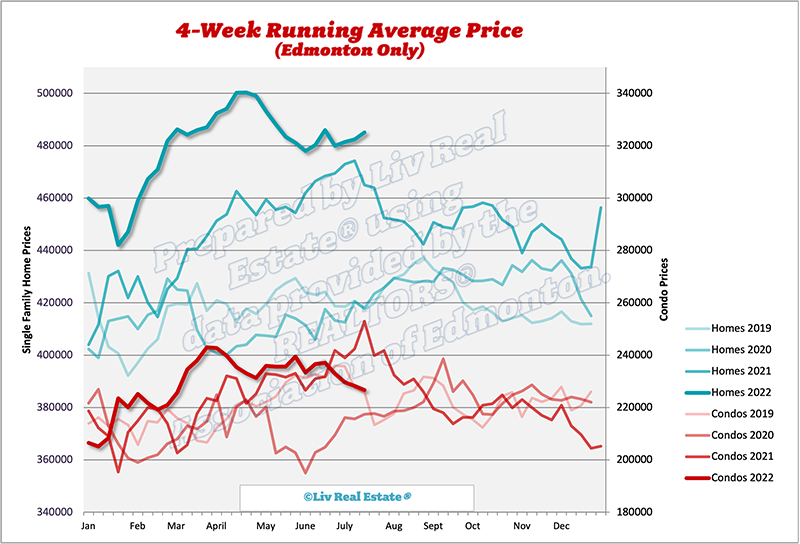
Homes 4-week running average: $486 ($485, $482, $481)
Condos 4-week running average: $224 ($227, $228, $230)

925 Views, 2 Comments

Here is our update on the Edmonton real estate market. (Previous week’s numbers are in brackets). For the past 7 days:

New Listings: 638 (720, 646, 681)
Sales: 372 (385, 309, 415)
Ratio: 58% (53%, 48%, 61%,)
Price Changes: 571 (654, 521, 568)
Expired/Off-Market Listings: 239 (238, 437, 412)
Net loss/gain in listings this week: 27 (97, -100, -146)
Active single-family home listings: 3636 (3545, 3420, 3376)
Active condo listings: 2533 (2495, 2447, 2382)
Homes 4-week running average: $485 ($482, $481, $480)
Condos 4-week running average: $227 ($228, $230, $233)

872 Views, 1 Comments

Nothing says summer like ice cream on a hot day, so we’ve rounded up some of the best local spots to grab a scoop (or a swirl) in the Greater Edmonton Area this summer. 

Made By Marcus

(Brewery District & Whyte Avenue) 

Made by Marcus promises honest ingredients, innovative flavours and a superior experience. Originating in Calgary before expanding to Edmonton, Made by Marcus experiments with uncommon flavour profiles using locally sourced ingredients to create premium ice cream featuring some of the wildest flavour combinations. Each batch is built from scratch with dairy from grass-fed cows and real ingredients produced by farmers, roasters, distillers and artisans they know and trust. It’s no wonder people line up for their ice cream. 

1074 Views, 1 Comments

Here is our update on the Edmonton real estate market. (Previous week’s numbers are in brackets). For the past 7 days:

New Listings: 720 (646, 681, 700)
Sales: 385 (309, 415, 441)
Ratio: 53% (48%, 61%, 63%)
Price Changes: 654 (521, 568, 602)
Expired/Off-Market Listings: 238 (437, 412, 249)
Net loss/gain in listings this week: 97 (-100, -146, 10)
Active single-family home listings: 3545 (3420, 3376, 3331)
Active condo listings: 2495 (2447, 2382, 2499)
Homes 4-week running average: $482 ($481, $480, $486)
Condos 4-week running average: $228 ($230, $233, $237)

722 Views, 1 Comments

Here is our update on the Edmonton real estate market. (Previous week’s numbers are in brackets). For the past 7 days:

New Listings: 646 (681, 700, 776)
Sales: 309 (415, 441, 465)
Ratio: 48% (61%, 63%, 60%)
Price Changes: 521 (568, 602, 592)
Expired/Off-Market Listings: 437 (412, 249, 235)
Net loss/gain in listings this week: -100 (-146, 10, 76)
Active single-family home listings: 3420 (3376, 3331, 3257)
Active condo listings: 2447 (2382, 2499, 2410)
Homes 4-week running average: $481 ($480, $486, $480)
Condos 4-week running average: $230 ($233, $237, $237)

732 Views, 0 Comments

The real estate market in Edmonton is a tale of two-time frames; when we look at the stats year over year things look very good, but compared to just a few months ago, things have really slowed down. This, of course, is actually good news because overheated markets are not good in the long run. Interestingly, Calgary sales are down about 2% from last year, while my preliminary look at the market shows sales of single-family homes and condos are still up in Edmonton (13% and 18%, respectively). 

“As expected, higher interest rates are starting to have an impact on home sales. This is helping shift the market toward more balanced conditions and taking some of the pressure off prices,” said CREB® Chief Economist Ann-Marie Lurie. “While we are starting to…

4957 Views, 1 Comments

Here is our update on the Edmonton real estate market. (Previous week’s numbers are in brackets). For the past 7 days:

New Listings: 681 (700, 776, 803)
Sales: 415 (441, 465, 455)
Ratio: 61% (63%, 60%, 57%)
Price Changes: 568 (602, 592, 643)
Expired/Off-Market Listings: 412 (249, 235, 190)
Net loss/gain in listings this week: -146 (10, 76, 158)
Active single-family home listings: 3376 (3331, 3257, 3150)
Active condo listings: 2382 (2499, 2410, 2448)
Homes 4-week running average: $480 ($486, $480, $478)
Condos 4-week running average: $233 ($237, $237, $233)


711 Views, 0 Comments