Here is our update on the Edmonton real estate market. (Previous week’s numbers are in brackets). For the past 7 days:

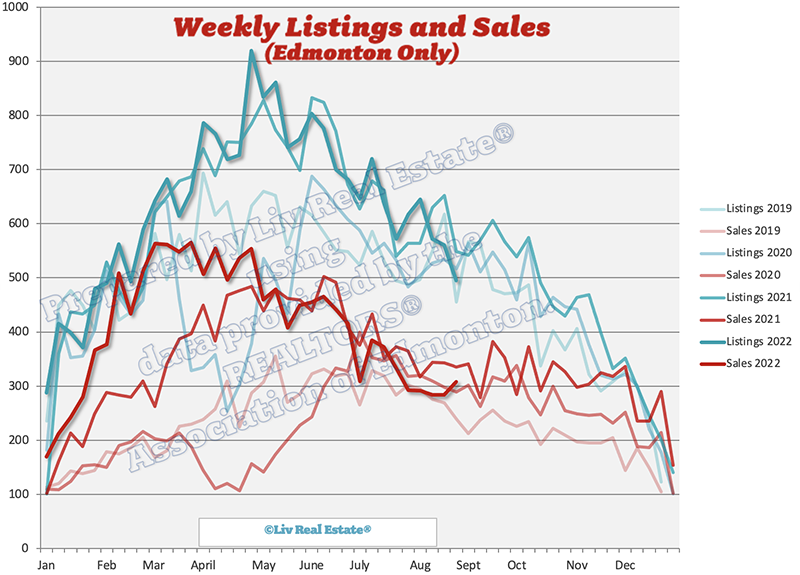
New Listings: 514 (563, 633, 611)
Sales: 278 (287, 317, 238)
Ratio: 54% (51%, 50%, 39%)
Price Changes: 479 (513, 559, 514)
Expired/Off-Market Listings: 287 (334, 344, 313)
Net loss/gain in listings this week: -51 (-58, -28, 60)
Active single-family home listings: 3693 (3708, 3668, 3620)
Active condo listings: 2287 (2285, 2284, 2297)
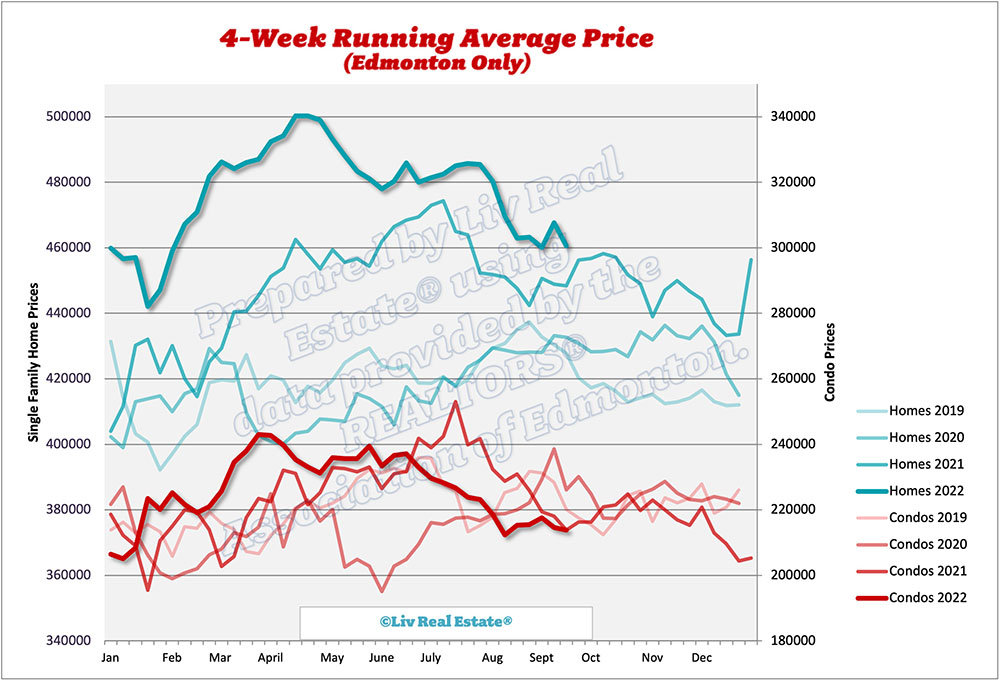
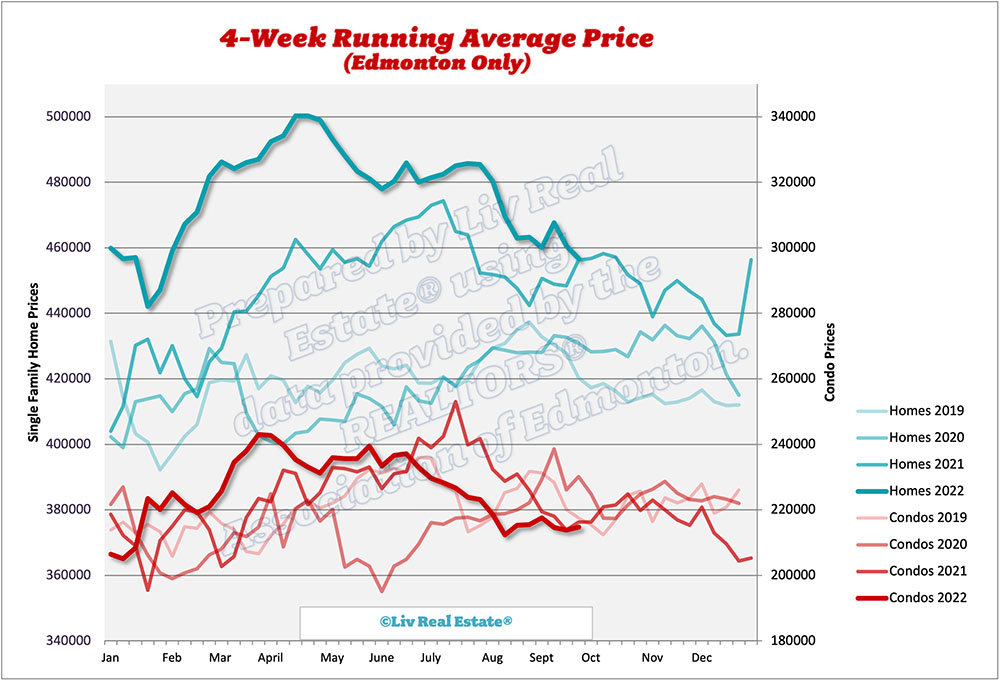
Homes 4-week running average: $457 ($461, $468, $460)
Condos 4-week running average: $215 ($214, $215, $218)

805 Views, 1 Comments

Here is our update on the Edmonton real estate market. (Previous week’s numbers are in brackets). For the past 7 days:

New Listings: 563 (633, 611, 495)
Sales: 287 (317, 238, 308)
Ratio: 51% (50%, 39%, 62%)
Price Changes: 513 (559, 514, 514)
Expired/Off-Market Listings: 334 (344, 313, 632)
Net loss/gain in listings this week: -58 (-28, 60, -445)
Active single-family home listings: 3708 (3668, 3620, 3554)
Active condo listings: 2285 (2284, 2297, 2281)
Homes 4-week running average: $461 ($468, $460, $463)
Condos 4-week running average: $214 ($215, $218, $215)


950 Views, 5 Comments

Here is our update on the Edmonton real estate market. (Previous week’s numbers are in brackets). For the past 7 days:

New Listings: 633 (611, 495, 560)
Sales: 317 (238, 308, 284)
Ratio: 50% (39%, 62%, 51%)
Price Changes: 559 (514, 514, 456)
Expired/Off-Market Listings: 344 (313, 632, 251)
Net loss/gain in listings this week: -28 (60, -445, 25)
Active single-family home listings: 3668 (3620, 3554, 3823)
Active condo listings: 2284 (2297, 2281, 2441)
Homes 4-week running average: $468 ($460, $463, $463)
Condos 4-week running average: $215 ($218, $215, $215)

806 Views, 0 Comments

Here is our update on the Edmonton real estate market. (Previous week’s numbers are in brackets). For the past 7 days:

New Listings: 611 (495, 560, 572)
Sales: 238 (308, 284, 284)
Ratio: 39% (62%, 51%, 50%)
Price Changes: 514 (514, 456, 461)
Expired/Off-Market Listings: 313 (632, 251, 274)
Net loss/gain in listings this week: 60 (-445, 25, 14)
Active single-family home listings: 3620 (3554, 3823, 3769)
Active condo listings: 2297 (2281, 2441, 2442)
Homes 4-week running average: $460 ($463, $463, $470)
Condos 4-week running average: $218 ($215, $215, $212)


855 Views, 1 Comments

Here is our update on the Edmonton real estate market. (Previous week’s numbers are in brackets). For the past 7 days:

New Listings: 495 (560, 572, 645)
Sales: 308 (284, 284, 292)
Ratio: 62% (51%, 50%, 45%)
Price Changes: 514 (456, 461, 566)
Expired/Off-Market Listings: 632 (251, 274, 296)
Net loss/gain in listings this week: -445 (25, 14, 57)
Active single-family home listings: 3554 (3823, 3769, 3717)
Active condo listings: 2281 (2441, 2442, 2444)
Homes 4-week running average: $463 ($463, $470, $480)
Condos 4-week running average: $215 ($215, $212, $219)


774 Views, 0 Comments

Sales have cooled even further through August in the Edmonton area; single-family sales were down 7% from last August and 12% from last month. The average price of single-family homes increased 2% from last year, and the median price was up 5.6% to $420,500.  I'll update this post later this week when the REALTORS® Association of Edmonton releases their monthly report on the housing market. Benchmark prices continue to rise, up 4% overall from August last year, while home sales continue to decline. Active listings are still up over this time last year, and while we are seeing a slight decline in new listings coming onto the market, the larger decline in sales is keeping the months of inventory in a balanced market. The Bank of Canada has increased rates…

1087 Views, 0 Comments