Here is our weekly update on the Edmonton real estate market. (Previous week's numbers are in brackets). For the past 7 days:

New Listings: 132 (223, 260, 424)
Sales: 151 (272, 241, 302)
Ratio: 114% (122%, 93%, 71%)
Price Changes: 55 (107, 219, 185)
Expired/Off-Market Listings: 87 (224, 140, 349)
Net loss/gain in listings this week: -106 (-273, -121, -227)
Active single-family home listings: 2101 (2150, 2253, 2317)
Active condo listings: 1299 (1252, 1321, 1357)
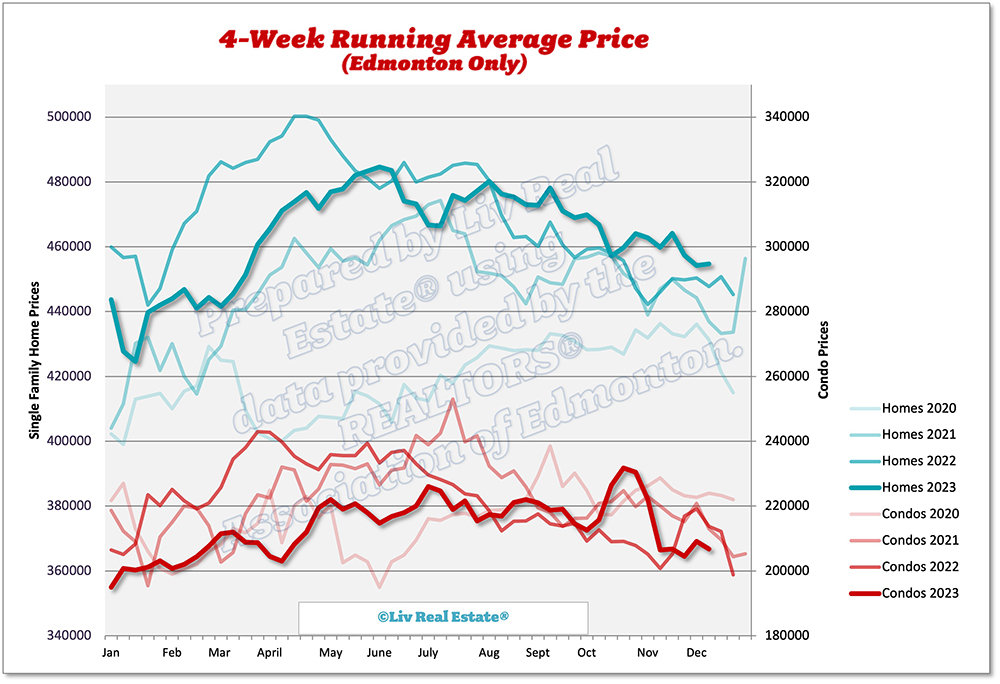
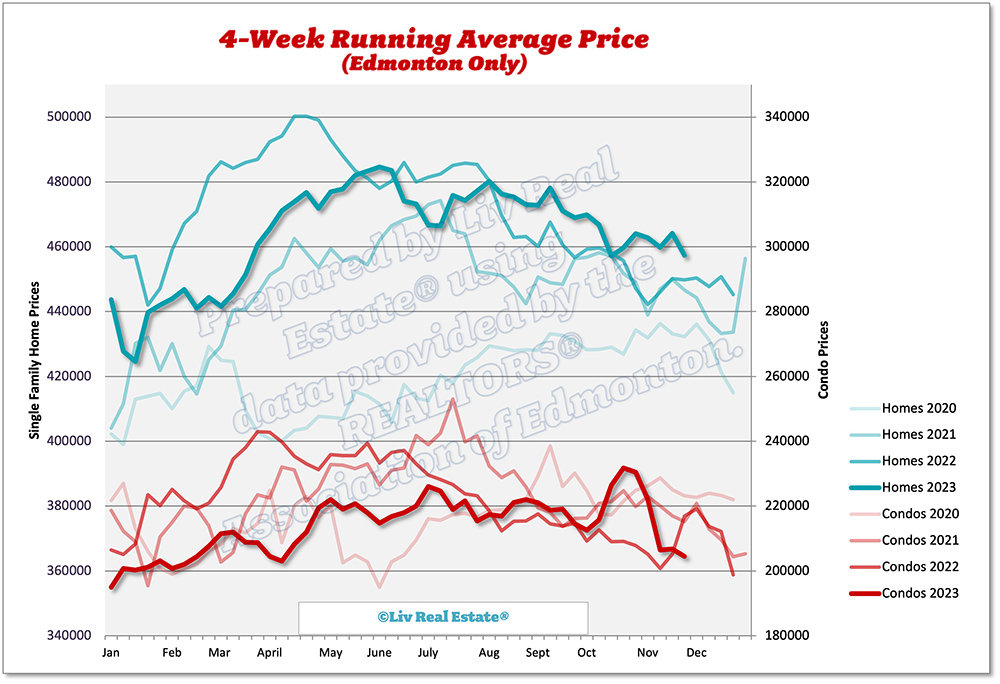
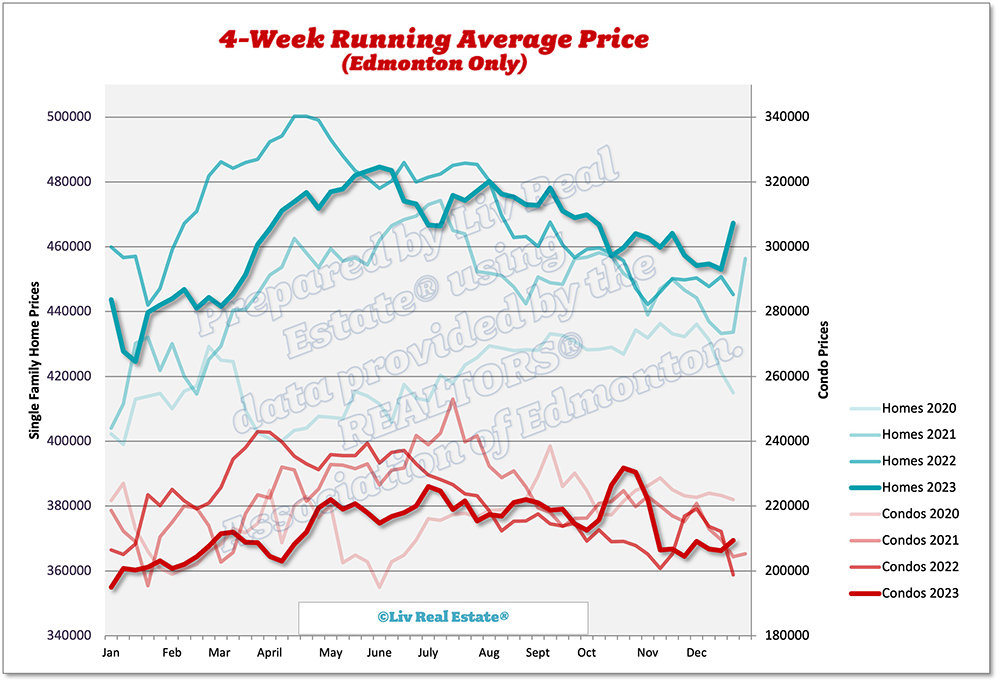
Homes 4-week running average: $467 ($453, $455, $454)
Condos 4-week running average: $209 ($206, $207, $209)

423 Views, 0 Comments

Here is our update on the Edmonton real estate market. (Previous week's numbers are in brackets). For the past 7 days:

New Listings: 223 (260, 424, 328)
Sales: 272 (241, 302, 337)
Ratio: 122% (93%, 71%, 103%)
Price Changes: 107 (219, 185, 237)
Expired/Off-Market Listings: 224 (140, 349, 391)
Net loss/gain in listings this week: -273 (-121, -227, -400)
Active single-family home listings: 2150 (2253, 2317, 2321)
Active condo listings: 1252 (1321, 1357, 1324)
Homes 4-week running average: $453 ($455, $454, $457)
Condos 4-week running average: $206 ($207, $209, $205)

364 Views, 0 Comments

Here is our update on the Edmonton real estate market. (Previous week's numbers are in brackets). For the past 7 days:

New Listings: 260 (424, 328, 330)
Sales: 241 (302, 337, 304)
Ratio: 93% (71%, 103%, 92%)
Price Changes: 219 (185, 237, 210)
Expired/Off-Market Listings: 140 (349, 391, 195)
Net loss/gain in listings this week: -121 (-227, -400, -169)
Active single-family home listings: 2253 (2317, 2321, 2466)
Active condo listings: 1321 (1357, 1324, 1453)
Homes 4-week running average: $455 ($454, $457, $464)
Condos 4-week running average: $207 ($209, $205, $207)

417 Views, 0 Comments

Here is our update on the Edmonton real estate market. (Previous week's numbers are in brackets). For the past 7 days:

New Listings: 424 (328, 330, 371)
Sales: 302 (337, 304, 267)
Ratio: 71% (103%, 92%, 72%)
Price Changes: 185 (237, 210, 227)
Expired/Off-Market Listings: 349 (391, 195, 204)
Net loss/gain in listings this week: -227 (-400, -169, -100)
Active single-family home listings: 2317 (2321, 2466, 2554)
Active condo listings: 1357 (1324, 1453, 1468)
Homes 4-week running average: $454 ($457, $464, $460)
Condos 4-week running average: $209 ($205, $207, $206)

456 Views, 0 Comments

The Edmonton real estate market in November was nothing short of extraordinary. Sales jumped by 31% compared to last year in November - 1,637 listings sold. Meanwhile, inventory took a bit of a dip, dropping 15% to 5,447 listings. New listings were up 6%, with a total of 2,126 new listings hitting the market in November. With a mere 3.33 months of supply, it's safe to say the ball is definitely in the sellers' court.

The benchmark price for townhouses shot up by an impressive 7.4% over last year. Apartment-style condos weren't far behind, with a 4.2% increase. And even single-family homes got in on the action, seeing a respectable 2.6% rise in benchmark prices. This suggests that there is more demand for more attainable types of housing, such as…

585 Views, 0 Comments

The holiday season is upon us, and Edmonton is shining brightly with an array of enchanting events to make your December merry and bright. Whether you're seeking a charming Christmas market, dazzling light displays, or delightful workshops, this vibrant city has something for everyone. So grab your winter coat and join us as we explore the top local holiday happenings in Edmonton and surrounding communities.

Local Christmas Markets 

St. Albert Indoor Christmas Market 
The Enjoy Centre
November 25 - December 16

Old Fashioned Christmas Market 
Downtown Farmers Market
December 9 - 10

Butterdome Craft Sale 
Butter Dome, University of Alberta 
November 30 - December 3

X Mas Market Fort Edmonton Park 
Fort Edmonton Park
November 30 - December 17

637 Views, 0 Comments

Here is our update on the Edmonton real estate market. (Previous week's numbers are in brackets). For the past 7 days:

New Listings: 328 (330, 371, 382)
Sales: 337 (304, 267, 284)
Ratio: 103% (92%, 72%, 74%)
Price Changes: 237 (210, 227, 343)
Expired/Off-Market Listings: 391 (195, 204, 200)
Net loss/gain in listings this week: -400 (-169, -100, -102)
Active single-family home listings: 2321 (2466, 2554, 2604)
Active condo listings: 1324 (1453, 1468, 1499)
Homes 4-week running average: $457 ($464, $460, $463)
Condos 4-week running average: $205 ($207, $206, $222)

437 Views, 0 Comments