Here is our update on the Edmonton real estate market. (Previous week’s numbers are in brackets). For the past 7 days:

New Listings: 342 (345, 423, 487)
Sales: 202 (216, 230, 274)
Ratio: 59% (63%, 54%, 56%)
Price Changes: 246 (297, 327, 378)
Expired/Off-Market Listings: 245 (278, 292, 605)
Net loss/gain in listings this week: -105 (-149, -99, -392)
Active single-family home listings: 3118 (3161, 3226, 3236)
Active condo listings: 1852 (1884, 1912, 1939)
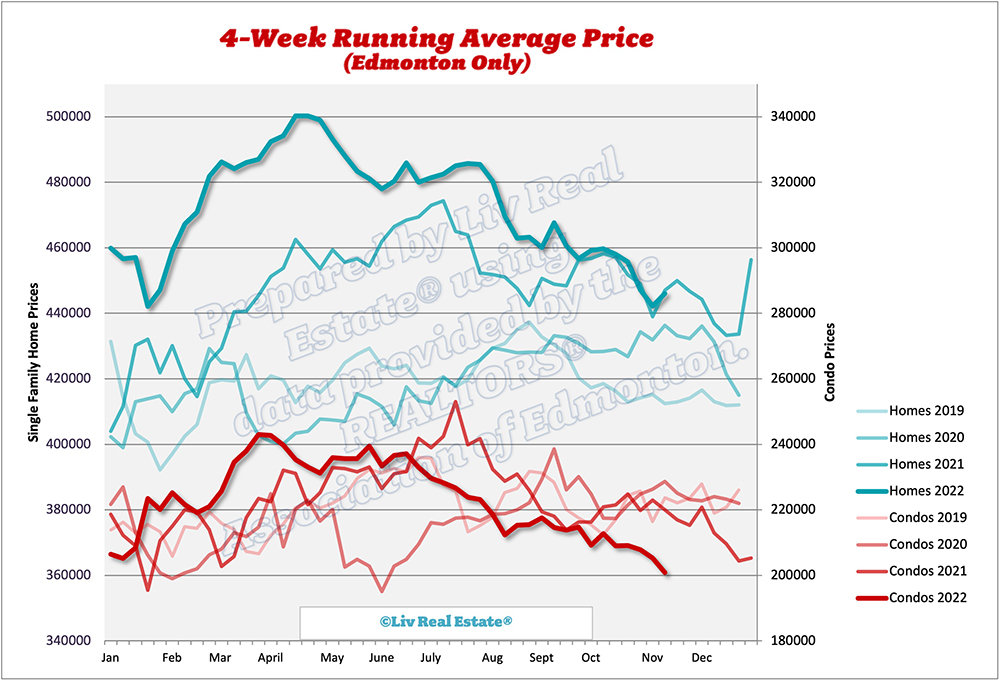
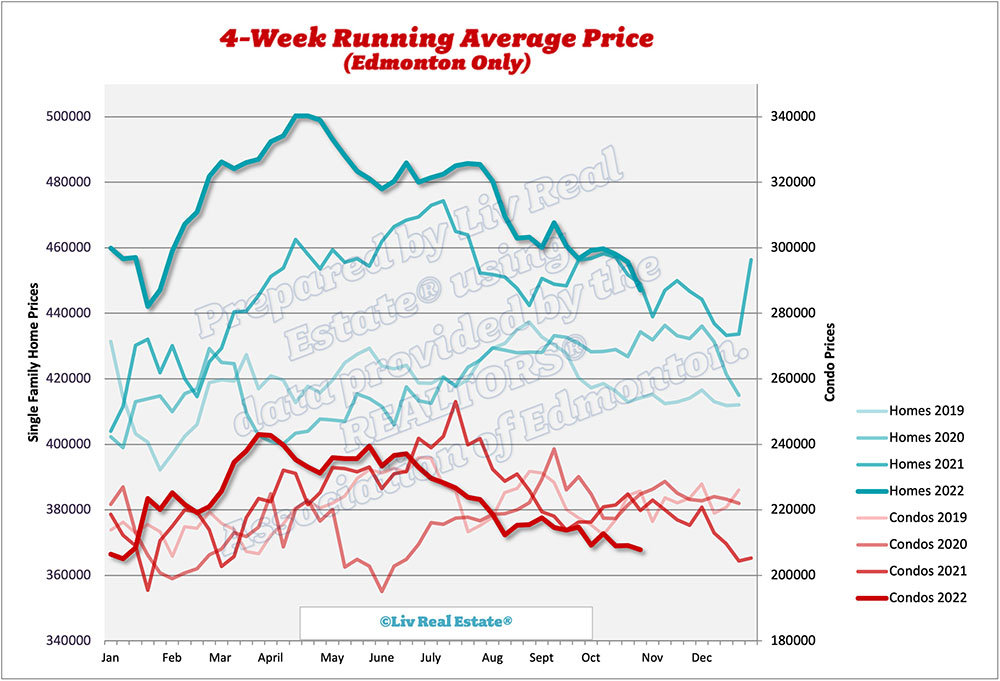
Homes 4-week running average: $450 ($446, $442, $447)
Condos 4-week running average: $205 ($201, $205, $208)

870 Views, 1 Comments

Here is our update on the Edmonton real estate market. (Previous week’s numbers are in brackets). For the past 7 days:

New Listings: 345 (423, 487, 412)
Sales: 216 (230, 274, 271)
Ratio: 63% (54%, 56%, 66%)
Price Changes: 297 (327, 378, 467)
Expired/Off-Market Listings: 278 (292, 605, 266)
Net loss/gain in listings this week: -149 (-99, -392, -125)
Active single-family home listings: 3161 (3226, 3236, 3413)
Active condo listings: 1884 (1912, 1939, 2080)
Homes 4-week running average: $446 ($442, $447, $456)
Condos 4-week running average: $201 ($205, $208, $209)

607 Views, 0 Comments

Here is our update on the Edmonton real estate market. (Previous week’s numbers are in brackets). For the past 7 days:

New Listings: 423 (487, 412, 519)
Sales: 230 (274, 271, 273)
Ratio: 54% (56%, 66%, 53%)
Price Changes: 327 (378, 467, 449)
Expired/Off-Market Listings: 292 (605, 266, 325)
Net loss/gain in listings this week: -99 (-392, -125, -79)
Active single-family home listings: 3226 (3236, 3413, 3469)
Active condo listings: 1912 (1939, 2080, 2119)
Homes 4-week running average: $442 ($447, $456, $458)
Condos 4-week running average: $205 ($208, $209, $209)


628 Views, 0 Comments

Here is our update on the Edmonton real estate market. (Previous week’s numbers are in brackets). For the past 7 days:

New Listings: 487 (412, 519, 433)
Sales: 274 (271, 273, 242)
Ratio: 56% (66%, 53%, 56%)
Price Changes: 378 (467, 449, 416)
Expired/Off-Market Listings: 605 (266, 325, 295)
Net loss/gain in listings this week: -392 (-125, -79, -104)
Active single-family home listings: 3236 (3413, 3469, 3477)
Active condo listings: 1939 (2080, 2119, 2121)
Homes 4-week running average: $447 ($456, $458, $460)
Condos 4-week running average: $208 ($209, $209, $213)

729 Views, 1 Comments

In October, the benchmark price for single-family homes in the Greater Edmonton Area dropped back to where it was about a year ago ($429,100 is down 0.3% from last October). Sales have cooled off to pre-pandemic levels in the Edmonton area, but the market hasn't cooled off nearly as much as in other parts of the country. The Calgary market is seeing a similar pullback in sales, while their prices are still higher than last year - detached homes in Calgary are nearly 12% higher than last October.  CREB® Chief Economist Ann-Marie Lurie summed it up perfectly: 

“Calgary hasn’t seen the same degree of pullback in housing sales like other parts of Canada, thanks to persistently strong demand for our higher density product. While our city is not immune to…

997 Views, 0 Comments