“Overall we’re seeing the Edmonton market operate below pre-recession levels,” she says. “Even looking on the labour side of the market — what really drives housing demand — we’re seeing lower employment, specifically full-time... If we see those fundamentals improve, then we can expect to see housing demand improve, but it will be a while still before we see conditions we saw during the boom periods in Edmonton.”With that said, the BoC cut rates this week, which lead to the prime rate falling to 3.45% (the rate at which buyers must qualify +2%) and mortgage rates followed suit. This could create encourage some hesitant buyers to move ahead with their plans to buy and heat up the spring market at bit, especially in the lower price ranges. Here's our February Market Infographic with all the details:

Edmonton Stats
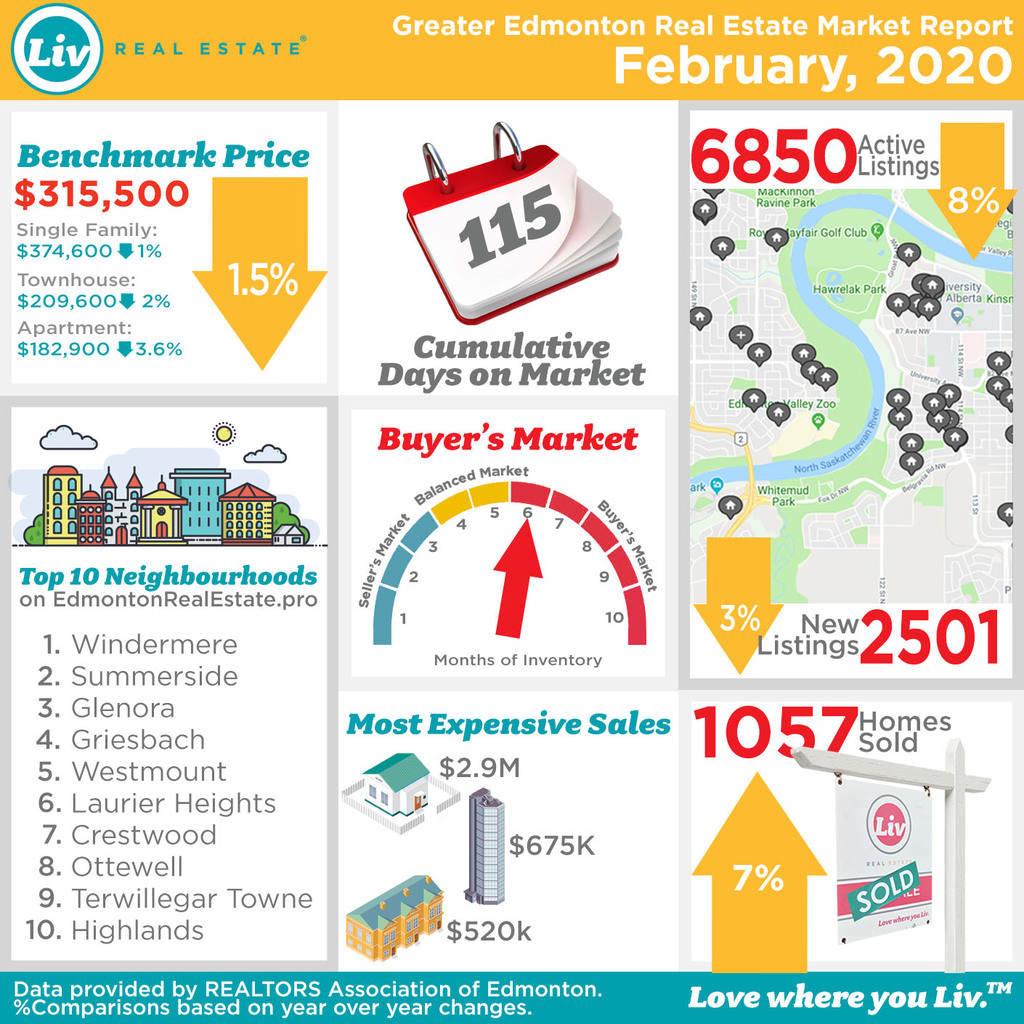
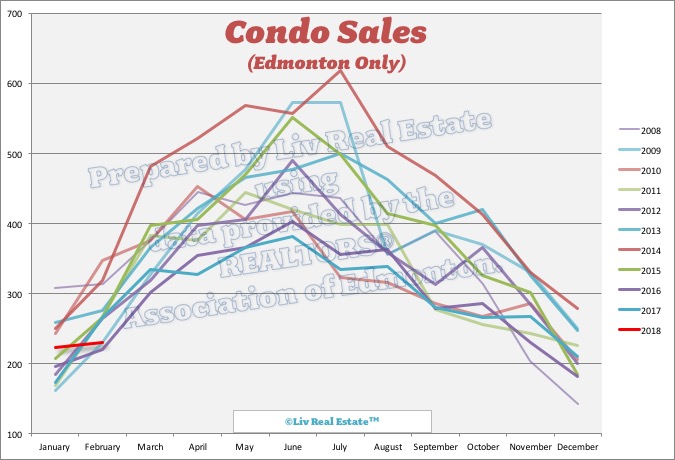
Our preliminary look at the real estate market in February shows sales activity this February looked a lot like last February 213 condos were reported sold, compared to 214 last year.
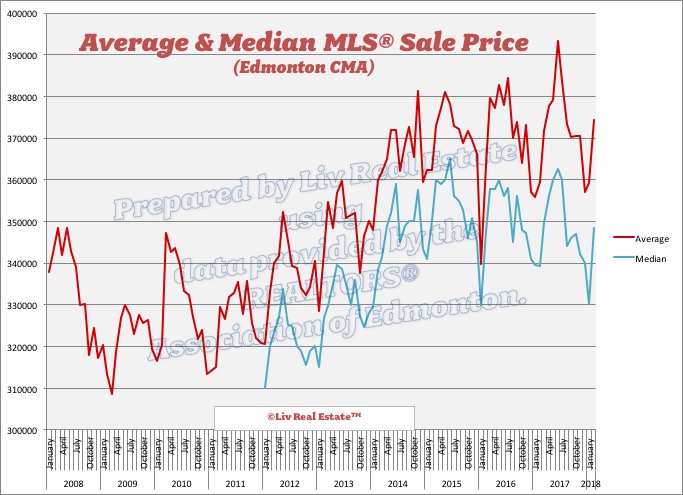
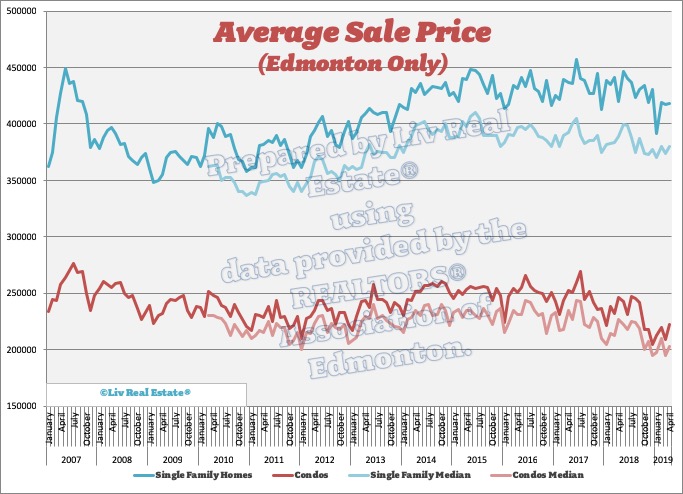
 The average sale price of a single-family home sold in Edmonton in February was $427,600, up 2% from last year and the median price was $365,000, down 4%. The average sale price of a condo sold in Edmonton in February was $208,228, down 5% from last year and the median price was $193,250, down 8%.
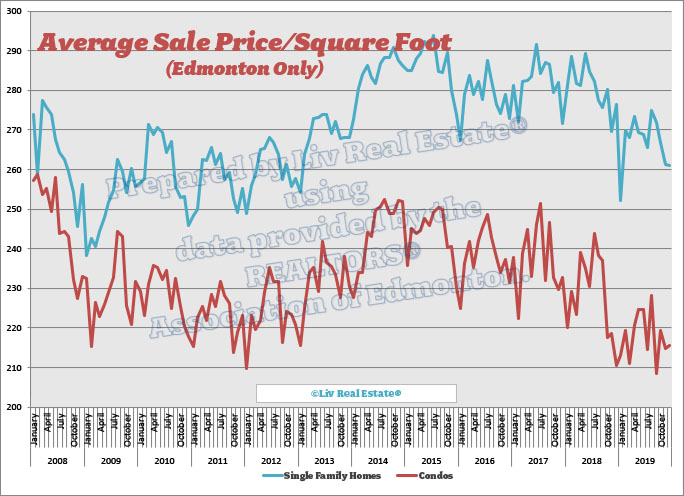
 The average price per square foot for single-family homes was down $2 from last year to $268 and for condos was down $16 to $203.
 Posted by Liv Real Estate
on
Posted by Liv Real Estate
on
1 Response to February Market Report - UPDATED
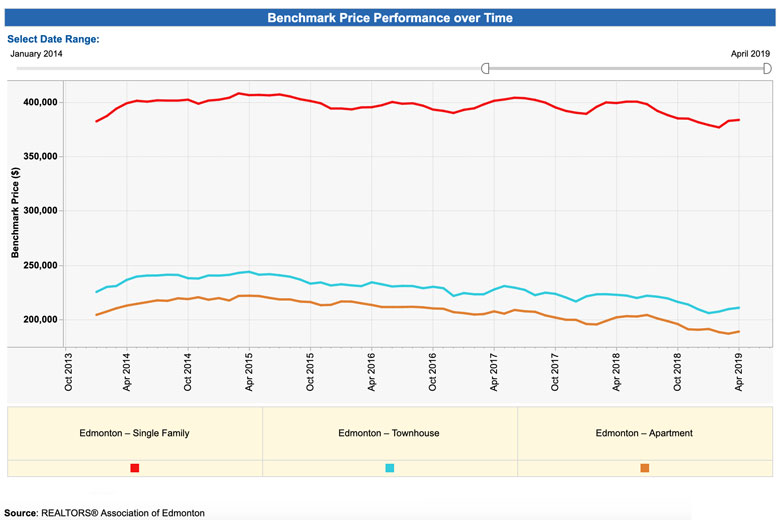
Hi Sara, I've appreciated you sharing these charts for a long time now. Any chance you could share the same data but adjusted for inflation? I think that might better represent price trends a little more clearly. For example the peak average single home price in 2007 of $450,000 is about $563,000 in today's dollars. Representing a real decline of 24% from the peak to now. Or if we used the Jan 2009 price of about $350,000 (the lowest I can see) that equates to $424,000 today suggesting this months average of $427,600 is on par with the lowest average price from the last 13 years.
Posted by Christopher Adams on Tuesday, March 3rd, 2020 at 10:34pmLeave A Comment