
Benchmark Prices
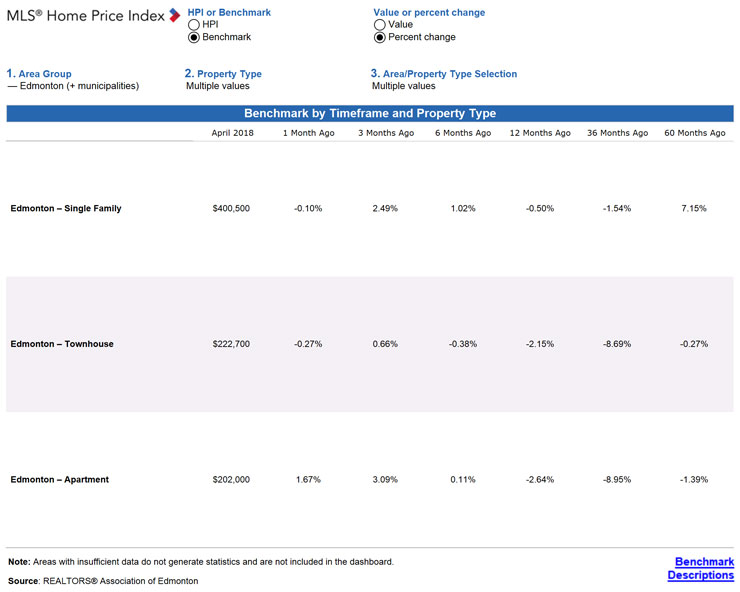
As I posted the other day, Edmonton now has the Home Price MLS® Home Price Index (HPI), which is a way of following pricing trends that is more accurate than using averages and medians (they can swing dramatically when the volume of high-end or low-end sales change over time). A “benchmark home” is set for each area (based on the most common attributes of homes traded in that area) and its value is tracked over time. As you can see, the benchmark prices don't fluctuate as much as the average and median prices. The benchmark price for single-family homes in the Edmonton area has stayed fairly flat since 2014, while apartments and townhouses have been on a slight downward trend since 2015. The benchmark single-family home for the Edmonton area is a 3 bedroom, 1322 square foot detached home, built in 1988, with a double attached garage, finished basement with a fourth bedroom, with 2 full bathrooms on a 5808 square foot lot. The benchmark townhouse is a three bedroom, 1151 square foot home with 1 full bathroom, built in 1984 with an attached single garage and the benchmark apartment is a 2 bedroom, 1 bathroom 925 square foot home with one indoor parking stall built in 1999. Each year the "benchmark" is set based on the most common attributes of homes sold over the past 5 previous years.
This chart shows the current benchmark value compared to various times in the past. Those who bought a single family home in Edmonton 5 years ago are doing pretty well right now, apartment prices could be turning around, based on the 3% increase over 3 months, we'll have to wait and see.
The benchmark single-family home for the Edmonton area is a 3 bedroom, 1322 square foot detached home, built in 1988, with a double attached garage, finished basement with a fourth bedroom, with 2 full bathrooms on a 5808 square foot lot. The benchmark townhouse is a three bedroom, 1151 square foot home with 1 full bathroom, built in 1984 with an attached single garage and the benchmark apartment is a 2 bedroom, 1 bathroom 925 square foot home with one indoor parking stall built in 1999. Each year the "benchmark" is set based on the most common attributes of homes sold over the past 5 previous years.
This chart shows the current benchmark value compared to various times in the past. Those who bought a single family home in Edmonton 5 years ago are doing pretty well right now, apartment prices could be turning around, based on the 3% increase over 3 months, we'll have to wait and see.
Greater Edmonton Area Charts
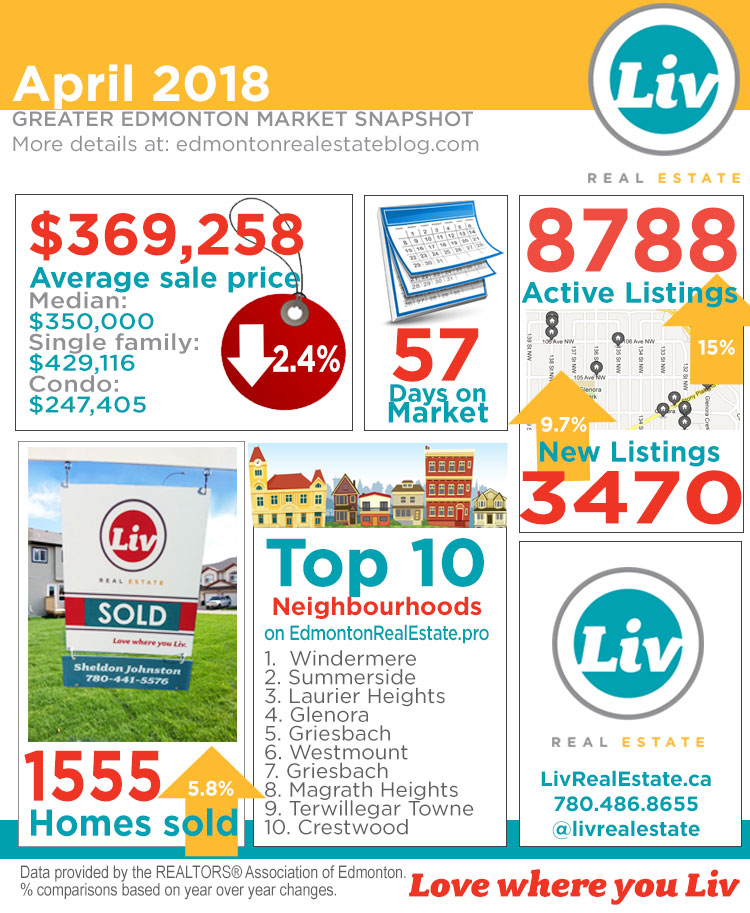
Sales were up 5.8% from last April to 1555 sales in the Greater Edmonton Area: The average price was down 2.4% to $369,258 and the median price was down 1.7% to $350,000:
 The inventory continued to climb in April to 8,788 listings:
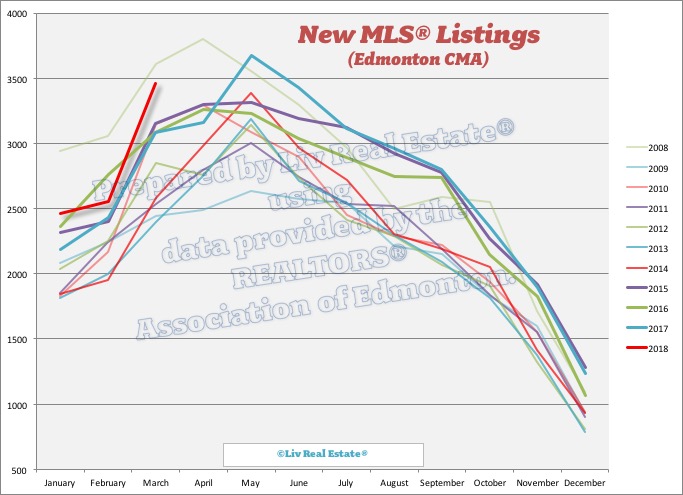
 New listings were higher than normal, but about equal to last month - perhaps they've peaked for this year:
Edmonton Stats
747 single-family homes were reported sold in April, about the same as last April's total, but below the normal number seen at this time of year.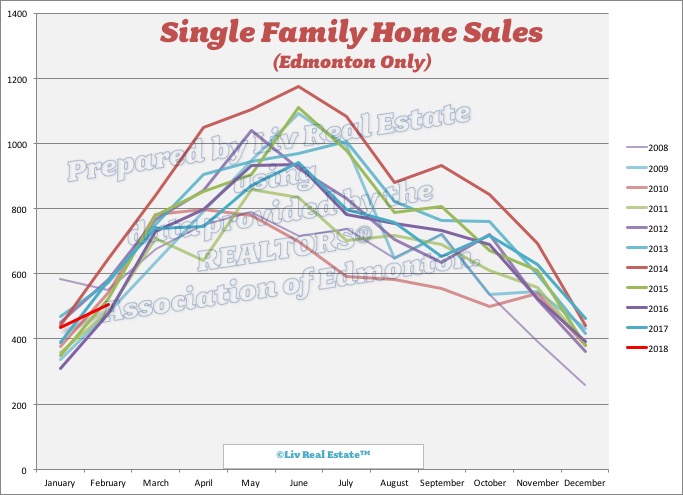 316 condos were reported sold in April, down 3.4% from last April to the lowest level we've seen in April in at least 10 years.
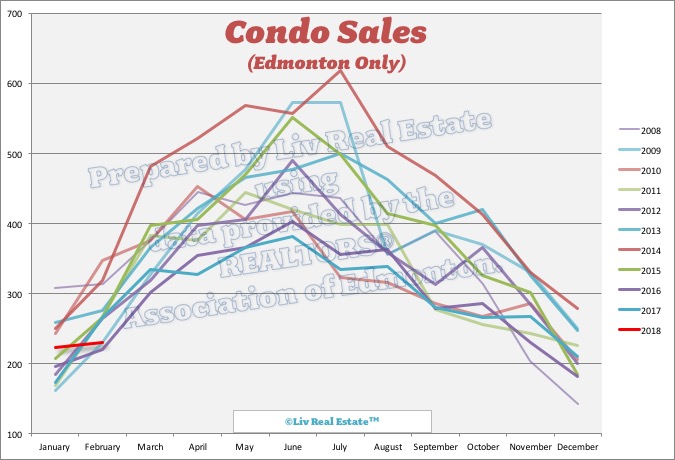 The average sale price for single-family homes was down 3.8% from last April to $420,065 and the median price was down 0.9% to $388,673. The average sale price for condos was down 2.5% to $246,424 and the median price was down 3.2% to $227,250.
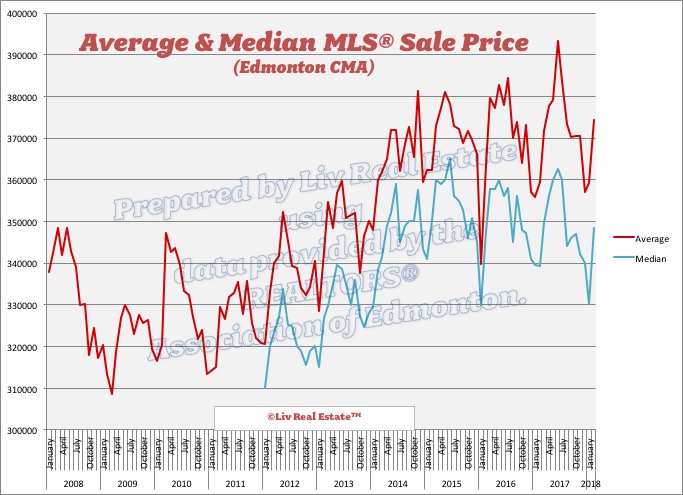 Average sale price per square foot for single-family homes was down $1 from last April to $281/square foot and for condos was down $6 to $239.
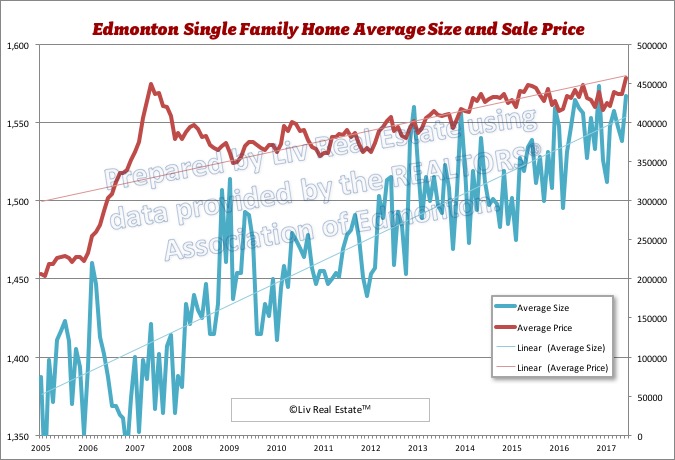
 The average size of single-family homes was down 3.4% to 1,494, falling below 1,500 square feet for the first time in over 2 years. Since the average price and average size of single-family homes fell by about the same amount, this suggests buyers are able to afford less (or are willing to spend less), which makes sense with borrowing costs and qualification requirements on the rise.
Enjoy this blog post? Click here to subscribe for updates
3 Responses to Home Buyers Spent Less in Edmonton in April - UPDATED
Hi Sara,
Posted by garry on Tuesday, May 1st, 2018 at 5:25amDo you think the cooler weather seen in early April had any impact on April home/condo sales?
I don't, we had a full-blown snow storm last year on April 15, overall I think the weather had very little to do with the market.
Posted by Sara MacLennan on Tuesday, May 1st, 2018 at 9:00pmGreat info, thanks Sara!
Posted by Trev on Thursday, May 3rd, 2018 at 3:11amLeave A Comment