Data is supplied by Pillar 9™ MLS® System. Pillar 9™ is the owner of the copyright in its MLS® System. Data is deemed reliable but is not guaranteed accurate by Pillar 9™. The trademarks MLS®, Multiple Listing Service® and the associated logos are owned by The Canadian Real Estate Association (CREA) and identify the quality of services provided by real estate professionals who are members of CREA. Used under license.
Data is deemed reliable but is not guaranteed accurate by the REALTORS® Association Of Edmonton. Copyright 2025 by the REALTORS® Association Of Edmonton. All rights reserved.
Trademarks are owned or controlled by the Canadian Real Estate Association (CREA) and identify real estate professionals who are members of CREA (REALTOR®, REALTORS®) and/or the quality of services they provide (MLS®, Multiple Listing Service®).


 Have a great weekend!
Posted by Liv Real Estate
on
7 Responses to Weekly Market Update June 1/18
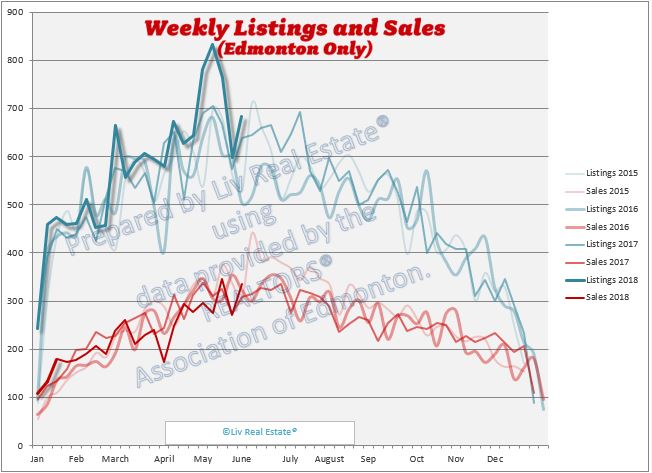
Thank you for the stats. It would be helpful to separate the sales and listings for SFH and condos. These are two different markets, and clumping them makes the picture clear.
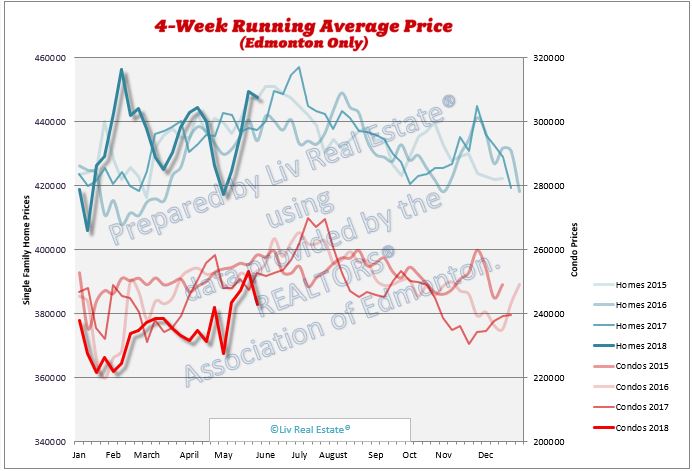
Posted by Yavi on Thursday, May 31st, 2018 at 9:10pmAlso, I'd suggest noisy graph of the 4-week running average really doesn't add much, and perhaps gives the wrong impression. It is so prone to variation on random factors. For example, the SFH running average price is below the running average price in February. This means nothing really.
Is This a broad based increase or just a few million dollar homes sold? I think someone mentioned already maybe the mean would be a better stat indicator.
Posted by Curtis on Friday, June 1st, 2018 at 6:34amOil prices went up but bad news came out of Saudi Arabia now they're going to pump more oil in the second half of the year. Looks like the downtrend for Edmonton real estate will resume after the blip upward.
Posted by Tony on Saturday, June 2nd, 2018 at 10:16pmThe best indicator is the benchmark price, which is in the monthly report - https://www.livrealestate.ca/blog/2018/06/home-sales-pick-up-in-edmonton-in-may.html
Posted by Sara MacLennan on Sunday, June 3rd, 2018 at 3:39amI post the inventory of condos and single-family homes separately on occasion. The weekly report is really just a glimpse of what's going on, the monthly reports are more in-depth. I'm not sure what you would have me replace the running average with, I'm open to suggestions. The best indicator is the benchmark price in our monthly report - https://www.livrealestate.ca/blog/2018/06/home-sales-pick-up-in-edmonton-in-may.html - but I can only get the benchmark price on a monthly basis.
Posted by Sara MacLennan on Sunday, June 3rd, 2018 at 3:43amI think the blip up in May was caused by lowering the variable rate by many banks in both Edmonton and Calgary because I was following up day by day specially in Calgary and May started very weak till mid May then it started to reverse slowly. That coincided with the lower variable.
Posted by Wally on Sunday, June 3rd, 2018 at 5:17amI also noticed this trend in other cities in other provinces. I just checked the rate and it's still low.
Scotiabank has stated that the number of mortgages they have approved this year compared to last year is down 50%. Yes. 50%
Posted by GM on Sunday, June 3rd, 2018 at 11:41pmWelcome to socialist utopia.
Leave A Comment