
 Posted by Liv Real Estate
on
Posted by Liv Real Estate
on
Posted by Liv Real Estate
on
Posted by Liv Real Estate
on
4 Responses to Weekly Market Update Nov.19/21
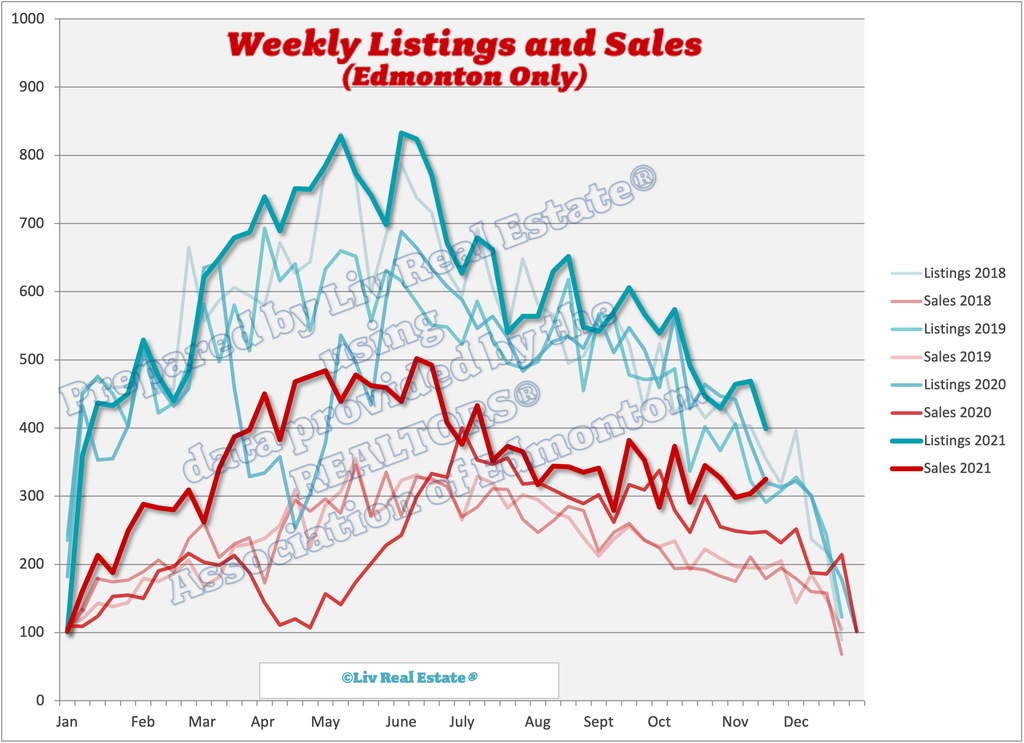
Thanks Sarah! Do you have a price chart as well? You just posted two listings/sales charts.
Posted by Tom on Thursday, November 18th, 2021 at 8:16pmSorry about that.... it's all fixed.
Posted by Sara MacLennan on Thursday, November 18th, 2021 at 8:21pmFirst chart is still off. The months are wrong.
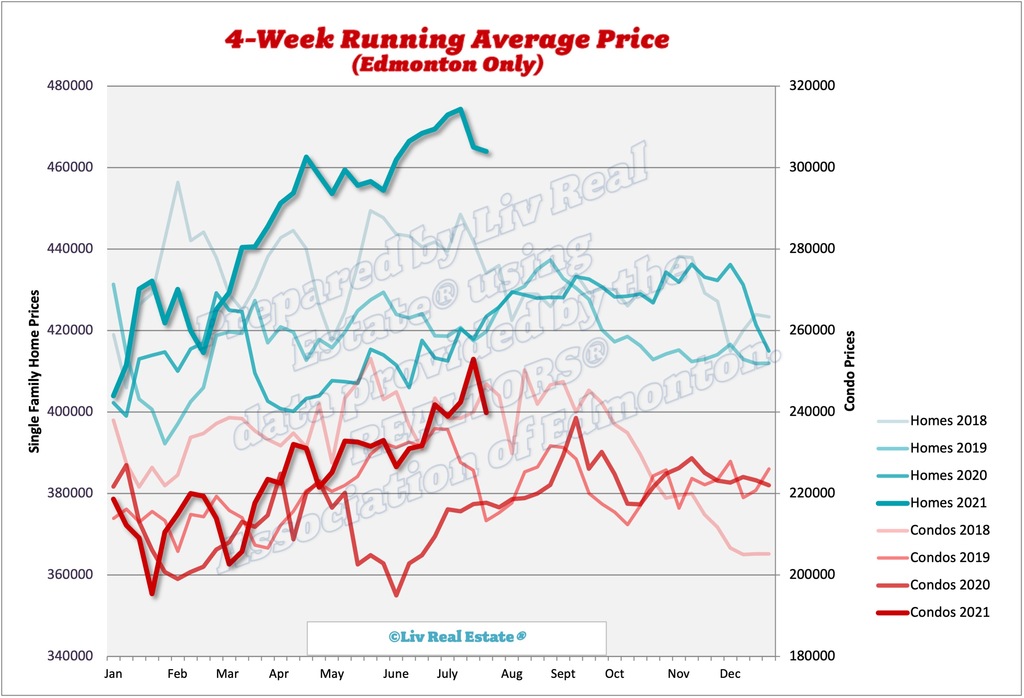
Posted by Jared on Thursday, November 18th, 2021 at 9:38pmThe 4-Week running average chart had been updated now as well.
Posted by Sara MacLennan on Thursday, November 18th, 2021 at 9:52pmLeave A Comment