Data is supplied by Pillar 9™ MLS® System. Pillar 9™ is the owner of the copyright in its MLS® System. Data is deemed reliable but is not guaranteed accurate by Pillar 9™. The trademarks MLS®, Multiple Listing Service® and the associated logos are owned by The Canadian Real Estate Association (CREA) and identify the quality of services provided by real estate professionals who are members of CREA. Used under license.
Data is deemed reliable but is not guaranteed accurate by the REALTORS® Association Of Edmonton. Copyright 2025 by the REALTORS® Association Of Edmonton. All rights reserved.
Trademarks are owned or controlled by the Canadian Real Estate Association (CREA) and identify real estate professionals who are members of CREA (REALTOR®, REALTORS®) and/or the quality of services they provide (MLS®, Multiple Listing Service®).


 Have a great weekend!
Posted by Liv Real Estate
on

6 Responses to Weekly Market Update, Nov. 9/18
Thanks for your weekly data! I am trying to understand your comment about number of sales over $1 million. There were 175 total sales, and so 16 sales over $1 million would be 9% of the unit sales, and the percent in value would be much more. Perhaps its 32% ?
Posted by Floyd on Thursday, November 8th, 2018 at 7:36pmAnd same for the week previous...I think you probably mean 16%, not 1.6%
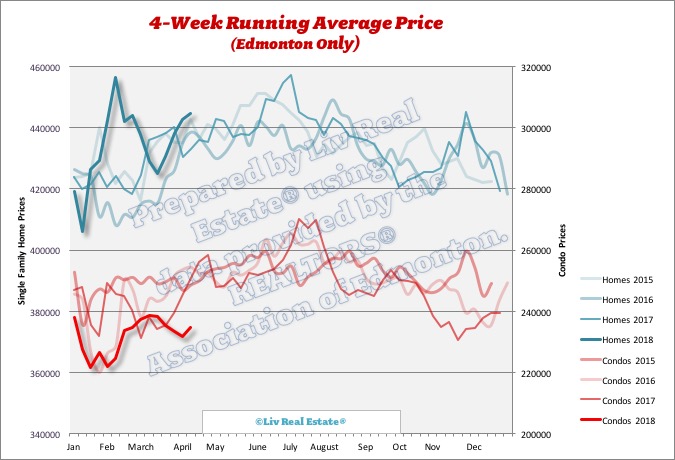
I also don't think that it is correct to dismiss the higher number of high value sales in a given week as an anomaly. You are accounting for this type of week to week variation by reporting the 4 week running average, which is good. The fact is that there are high valued houses being bought and sold, which is valid data that contributes to average home values in Edmonton.
Posted by Floyd on Thursday, November 8th, 2018 at 7:44pmSorry I wasn't more clear, I was basing those calculations on monthly sales. There were 498 sales of single family homes in the past 30 days, 16 were over $1million which is 3.2%.
Posted by Sara MacLennan on Thursday, November 8th, 2018 at 8:33pmIn a market with fewer than average sales a few sales at the top range can really skew the numbers.. especially like this week when there is 1 land sale for $3M. Additional commentary on these situations is necessary as it when most people look at "average price" they are looking for the "average price of an average house."
Posted by Greg on Thursday, November 8th, 2018 at 9:15pmI wonder how much of a price reduction those million dollar homes had to take to get their homes sold.
Posted by GM on Thursday, November 8th, 2018 at 9:15pm@GM I doubt much, if at all. The top end of the upper quartile in SFH generally isn't price-sensitive the way the rest of the market is, especially when it comes to the effects of lending standards.
Posted by Anonymous on Sunday, November 11th, 2018 at 2:18amIt's certainly not as if there are fewer people in that market now as opposed to before the changes to B-20.
Leave A Comment