Listing information last updated on October 16th, 2025 at 2:07am CDT.
Data is deemed reliable but is not guaranteed accurate by the REALTORS® Association Of Edmonton. Copyright 2025 by the REALTORS® Association Of Edmonton. All rights reserved.
Trademarks are owned or controlled by the Canadian Real Estate Association (CREA) and identify real estate professionals who are members of CREA (REALTOR®, REALTORS®) and/or the quality of services they provide (MLS®, Multiple Listing Service®).


 Have a great weekend!
Posted by Liv Real Estate
on
3 Responses to Weekly Update, September 25/20
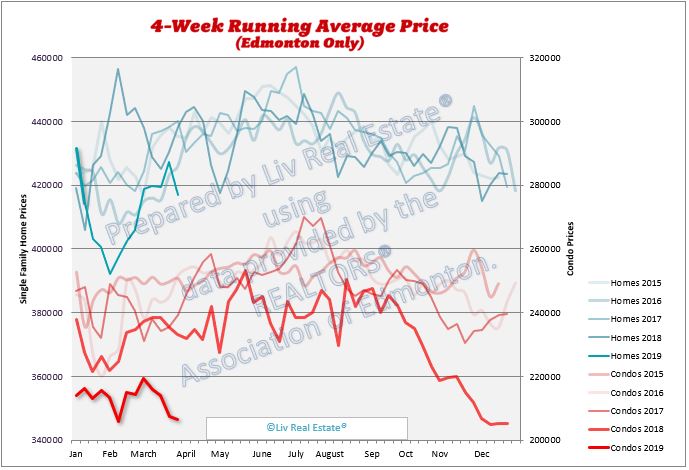
I and feeling positive about the condo trend, not great but it does seem neutral or better for late September. Thanks for the data!
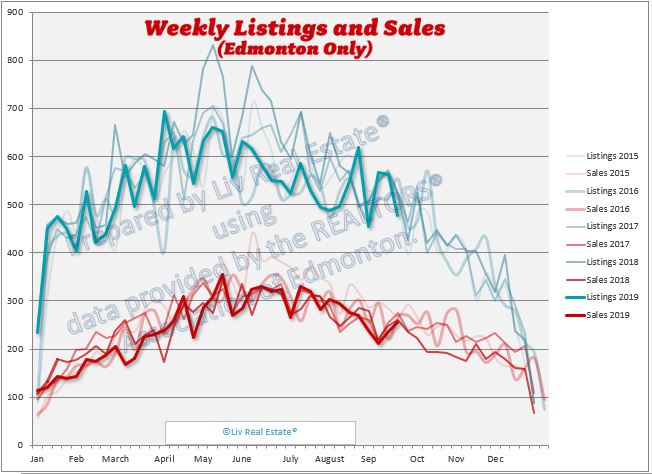
Posted by Chuck on Friday, September 25th, 2020 at 1:34amThanks for providing this info. One piece of constructive advice, please try to line up the content of the two graphs. I realize it's because one has two vertical axis, but if I'm trying to compare June sales to June prices, they don't line up. Keep up the good work!
Posted by Andrew on Thursday, October 1st, 2020 at 9:02pmHey Andrew,
Posted by Sara MacLennan on Tuesday, October 6th, 2020 at 6:32amThanks so much for the feedback. The two charts cover different time periods, one is a year over year comparison and one is showing the long term trend, so I can’t really line them up. You might find the monthly report has what you’re looking for.
Leave A Comment