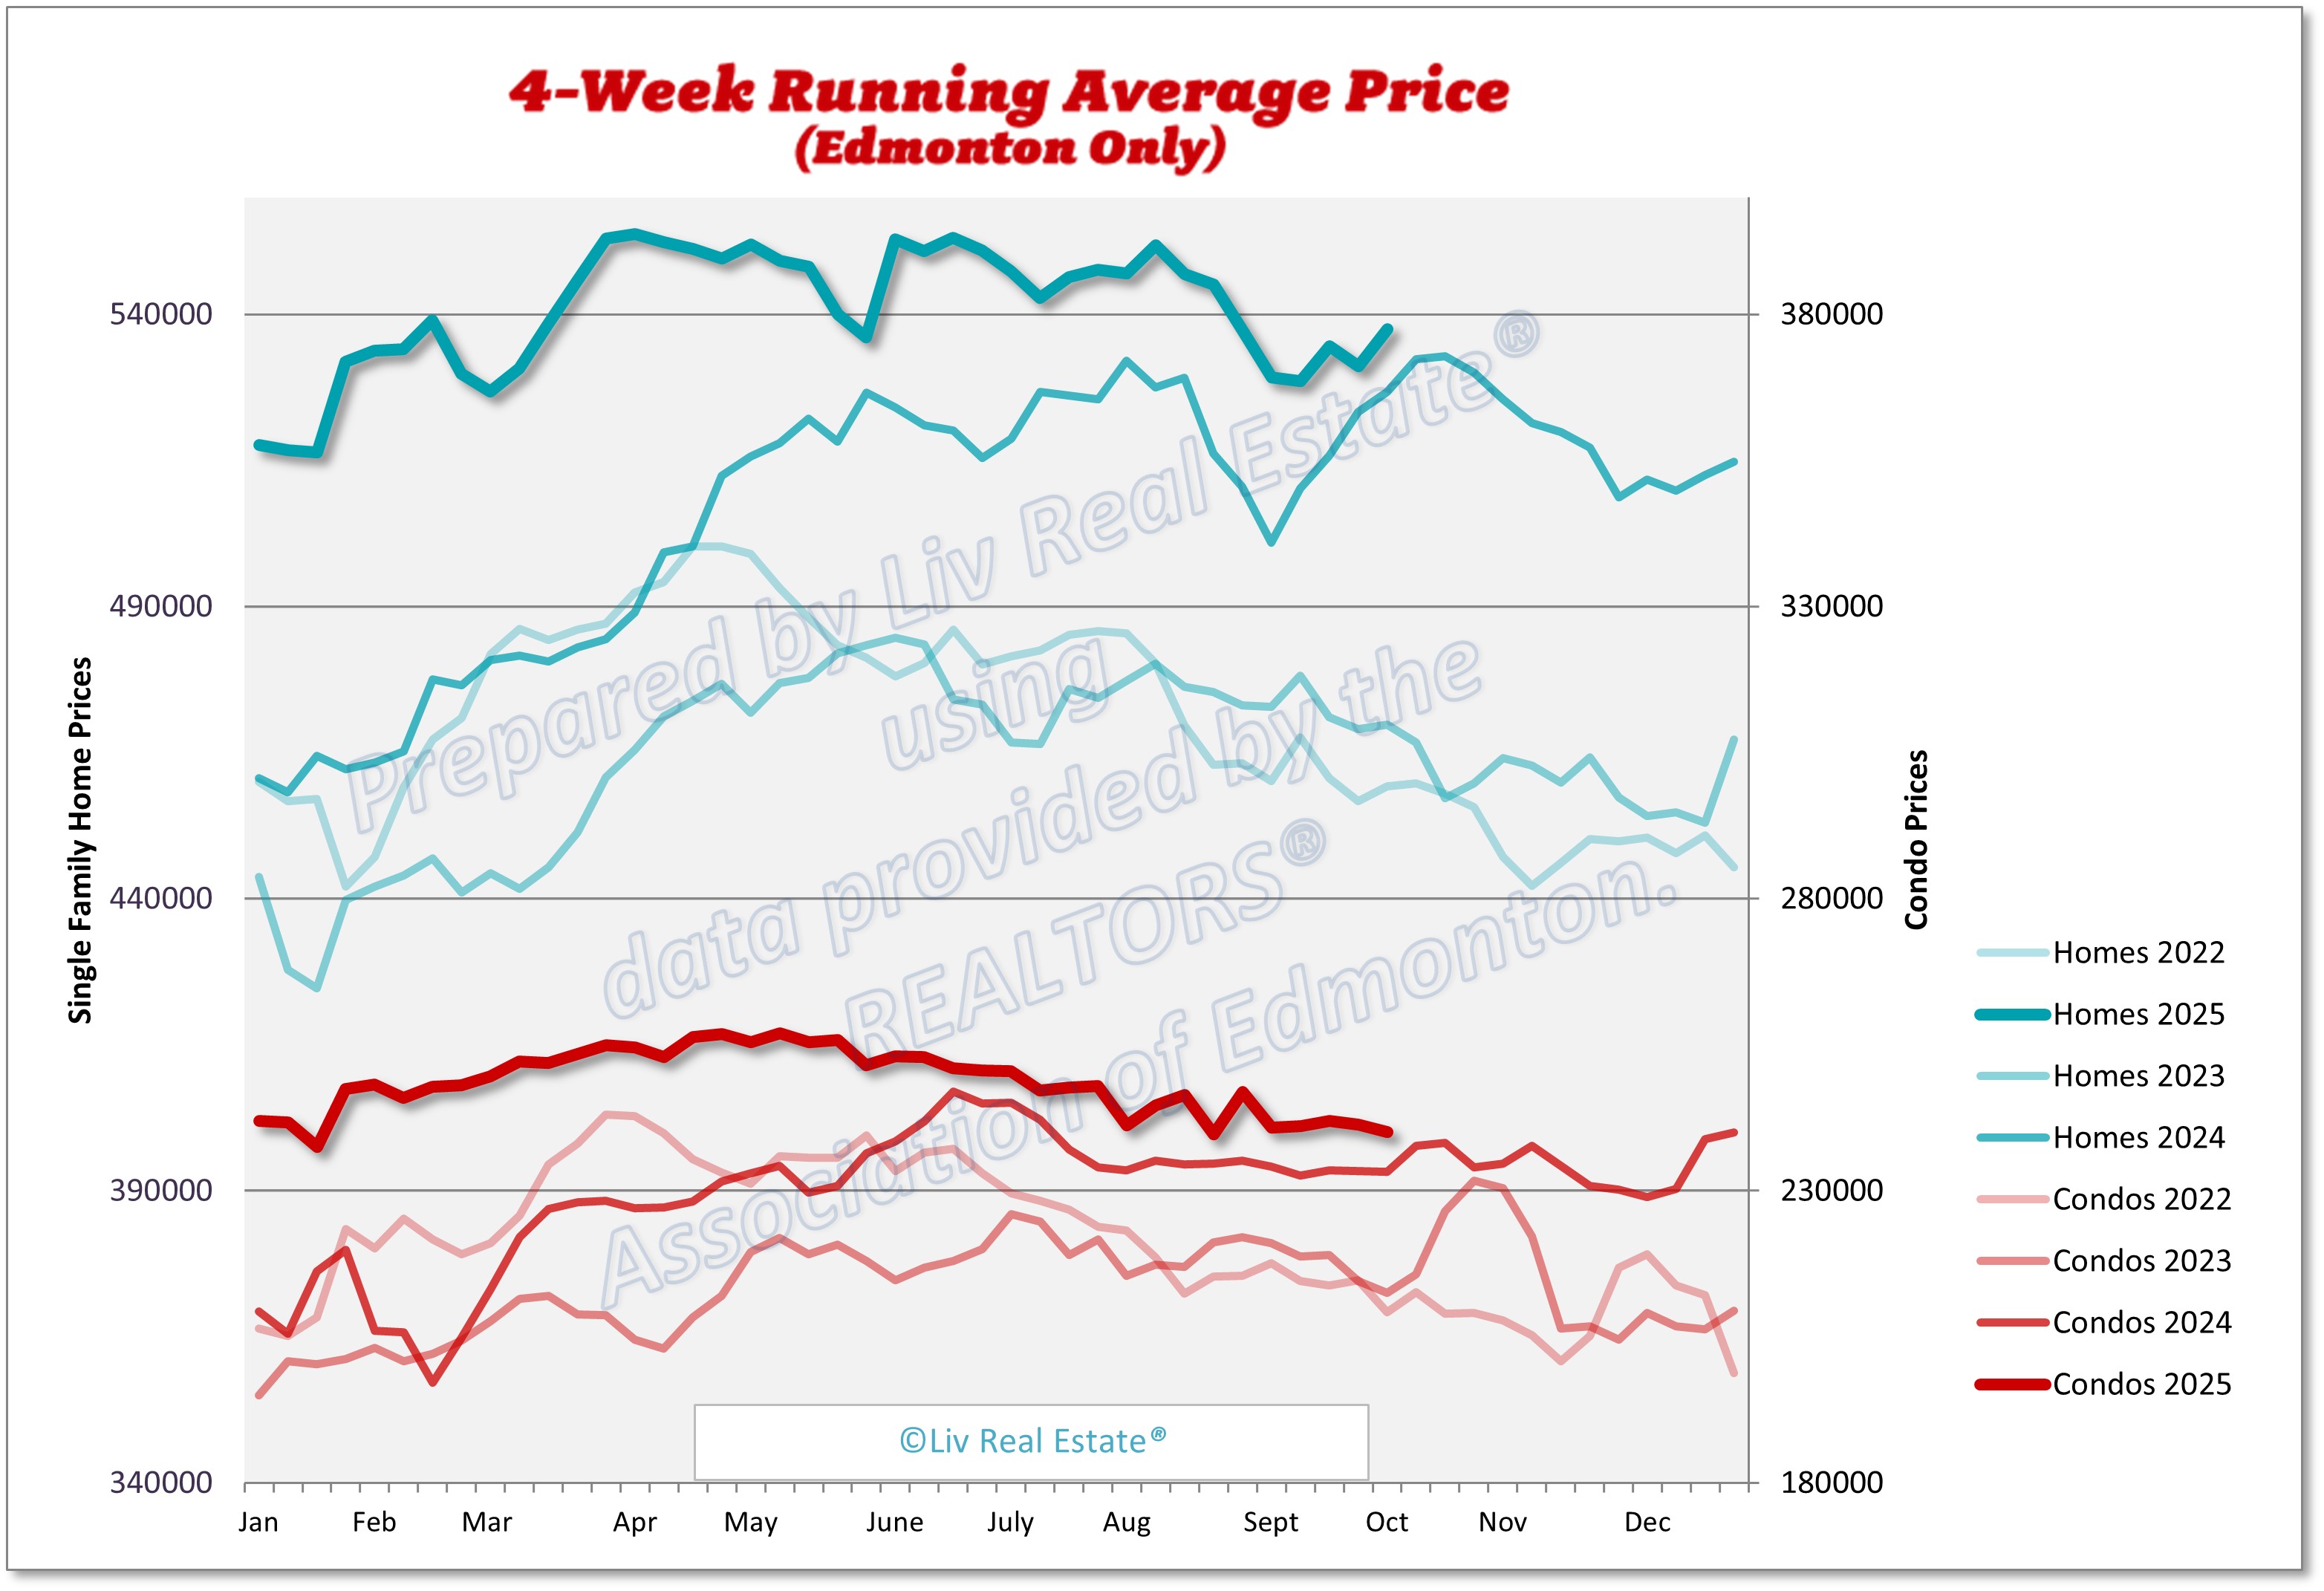
Here is our weekly update on the Edmonton real estate market for the past 7 days: (Previous week's numbers are in brackets). 

New Listings: 620 (589, 630, 653)
Sales: 346 (347, 373,406)
Ratio: 56% (59%, 59%, 62%)
Price Changes: 494 (453, 554, 450)
Expired/Off-Market Listings: 297 (476, 249, 320)
Net loss/gain in listings this week: -23 (-234, 8, -73)
Active single-family home listings: 3050 (3057, 3182, 3100)
Active condo listings: 1909 (1881, 1957, 1941)
Homes 4-week running average: $534 ($537, $531, $535)
Condos 4-week running average: $240 ($239, $241, $242)
89 Views, 0 Comments

Edmonton’s housing market entered fall with solid momentum. September sales totalled 2,191, down 3% from last year but still well above seasonal norms. With 3.23 months of supply, conditions continue to favour sellers, extending a two-year trend of tight inventory and steady price growth.

Prices continue to rise. The single-family benchmark rose 8% year-over-year to $513,900, while townhouses increased 6% to $284,300. Apartment-style condos edged up 1% to $199,100. Detached homes continue to lead the market, supported by slightly increased supply and sustained demand. 

On the supply side, conditions are improving. New listings increased 13% from August, and overall inventory climbed 24%, marking a gradual return toward balanced market levels. These…

252 Views, 0 Comments

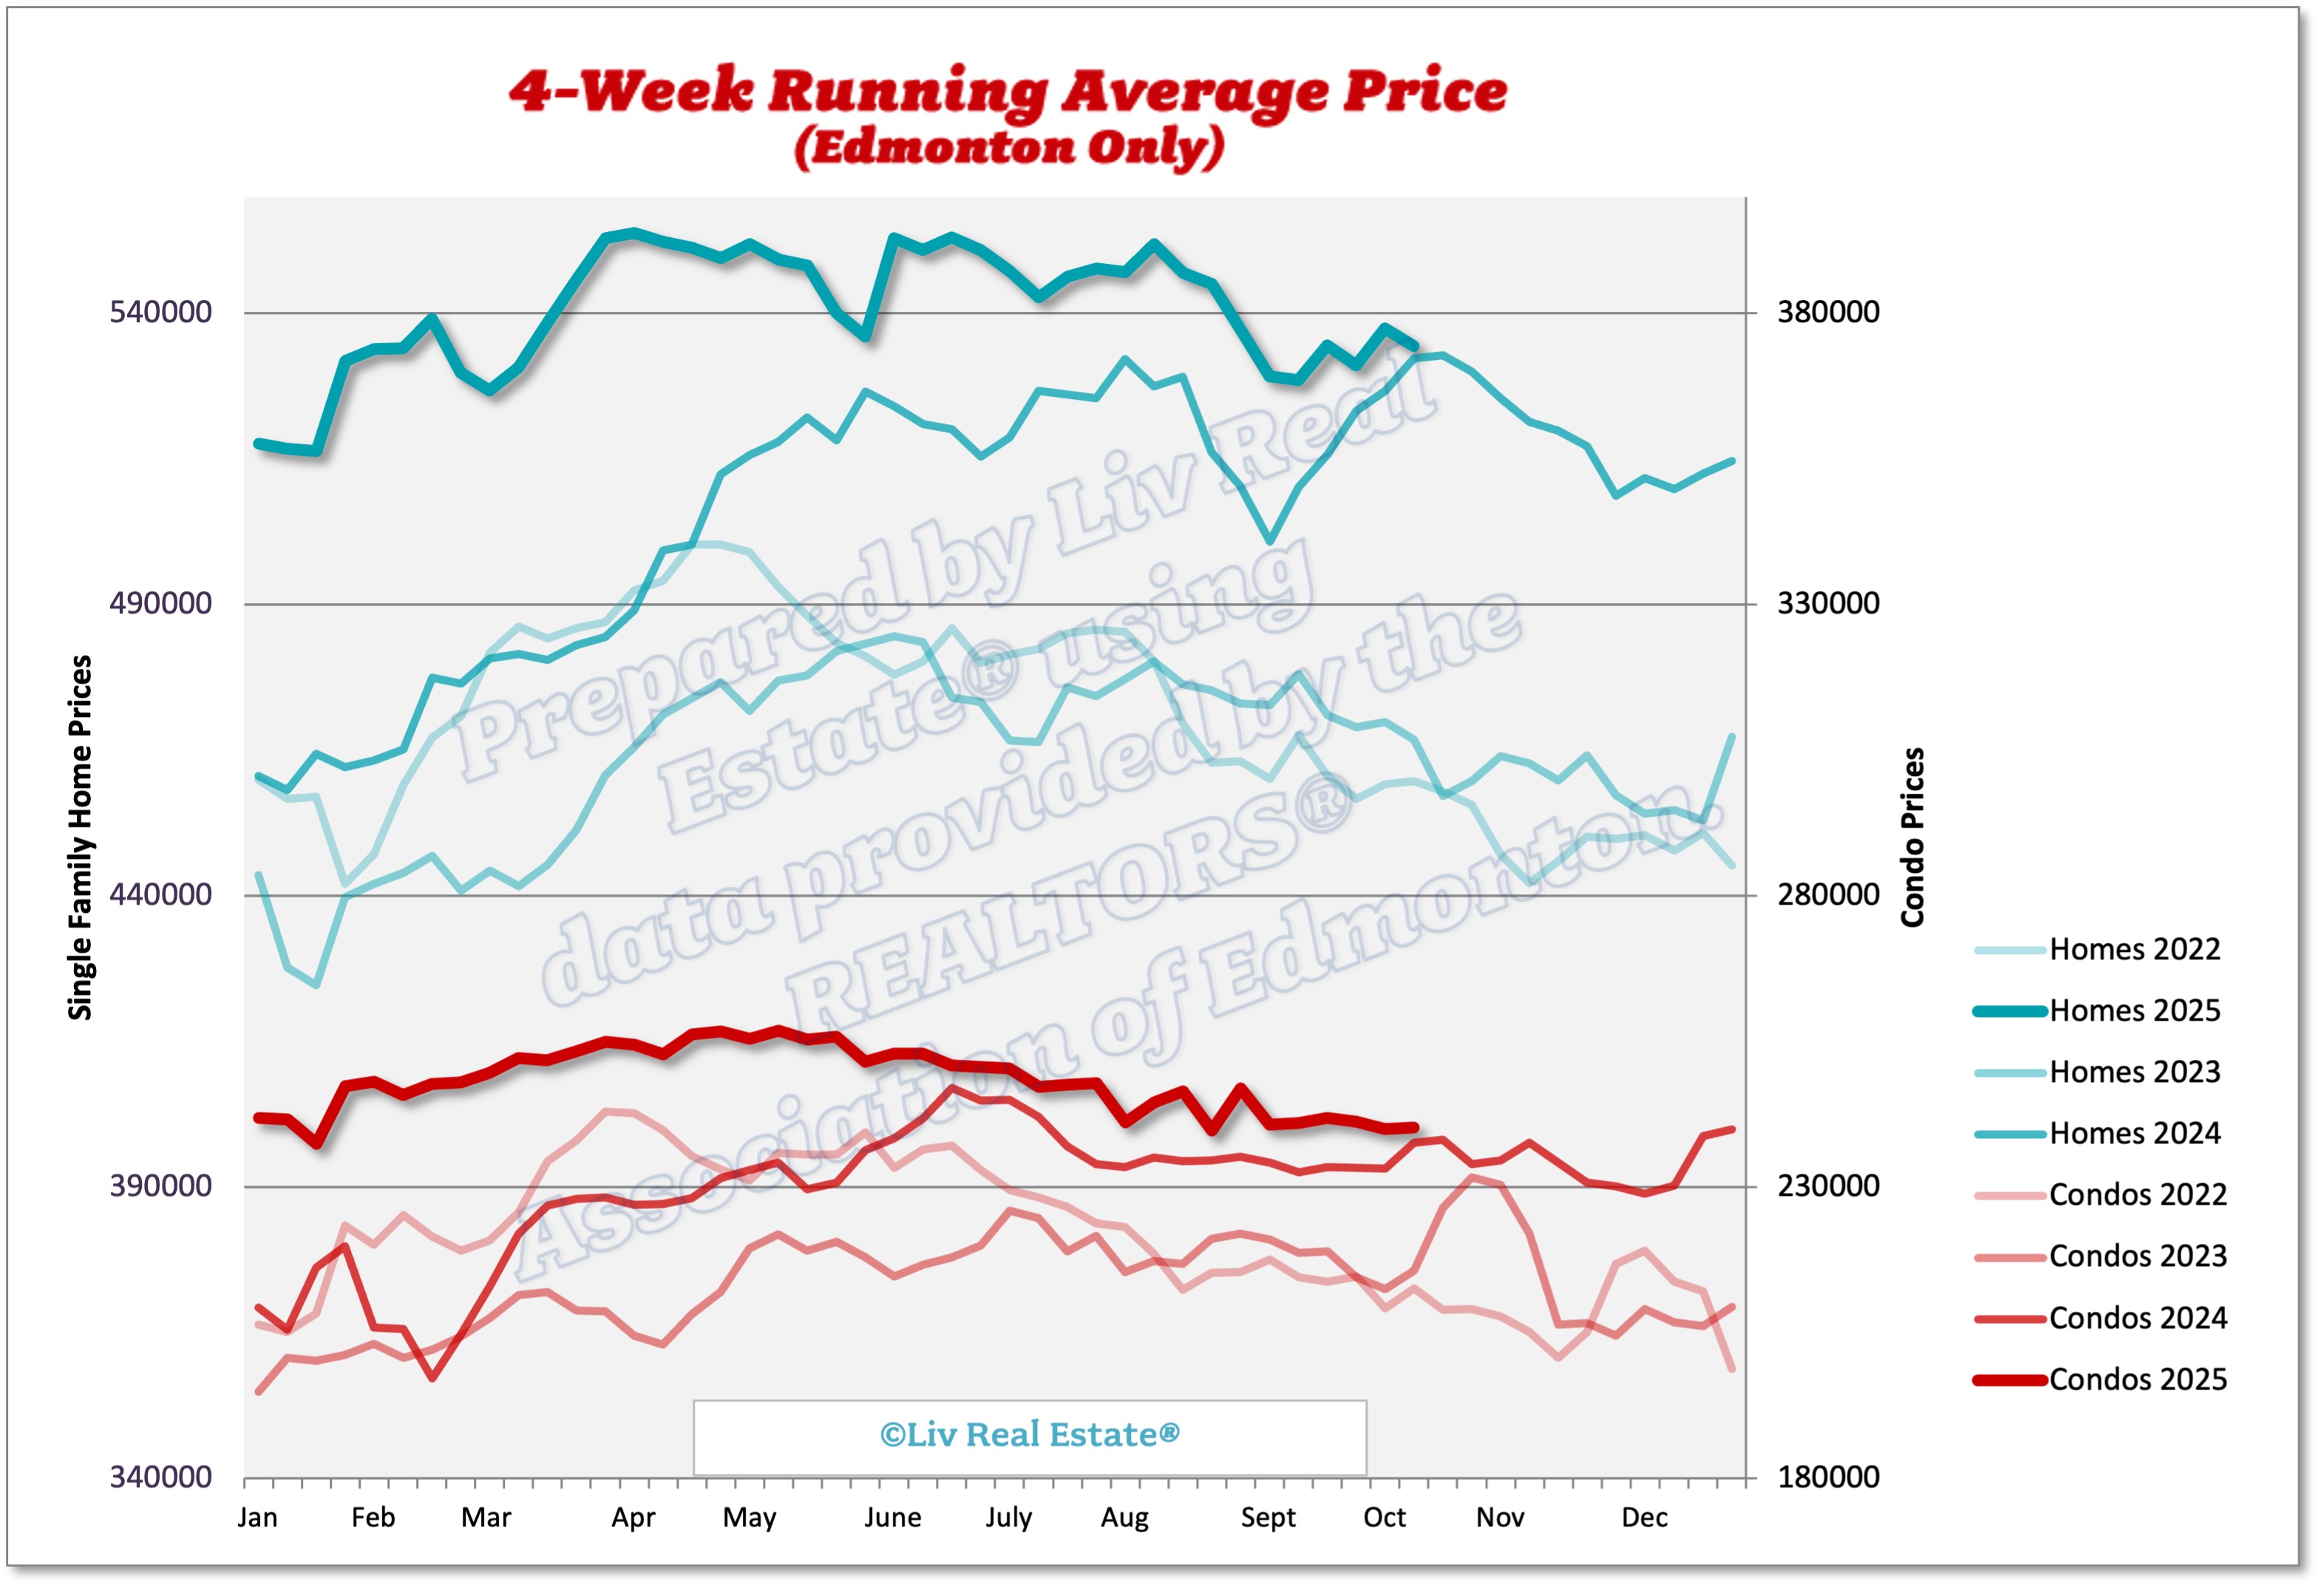
Here is our weekly update on the Edmonton real estate market for the past 7 days: (Previous week's numbers are in brackets). 

New Listings: 589(630, 653, 719)
Sales: 347(373,406, 352)
Ratio: 59%(59%, 62%, 49%)
Price Changes: 453(554, 450, 531)
Expired/Off-Market Listings: 476(249, 320, 285)
Net loss/gain in listings this week: -234(8, -73, 82)
Active single-family home listings: 3057(3182, 3100, 3085)
Active condo listings: 1881(1957, 1941, 1964)
Homes 4-week running average: $537($531, $535, $528)
Condos 4-week running average: $239($241, $242, $241)

4-Week Running Average Price

232 Views, 0 Comments