Here is our update on the Edmonton real estate market. (Previous week’s numbers are in brackets). For the past 7 days:

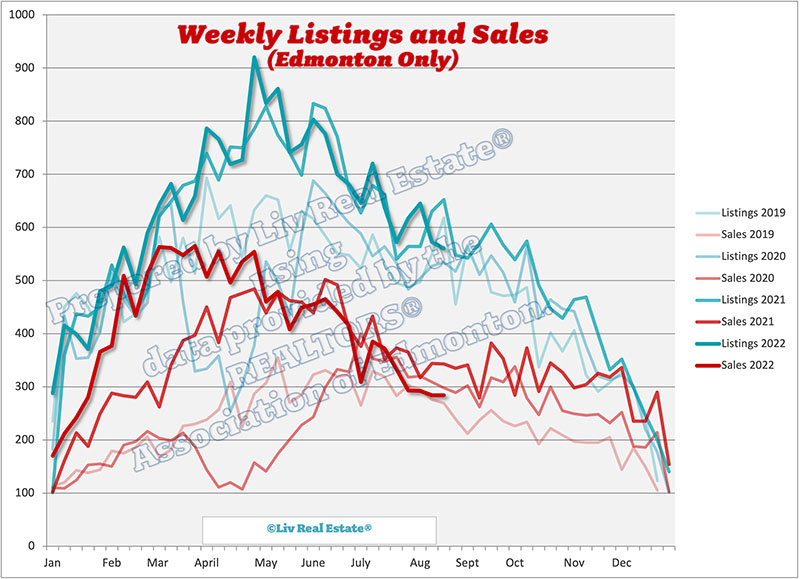
New Listings: 560 (572, 645, 617)
Sales: 284 (284, 292, 293)
Ratio: 51% (50%, 45%, 47%)
Price Changes: 456 (461, 566, 505)
Expired/Off-Market Listings: 251 (274, 296, 542)
Net loss/gain in listings this week: 25 (14, 57, -218)
Active single-family home listings: 3823 (3769, 3717, 3642)
Active condo listings: 2441 (2442, 2444, 2417)
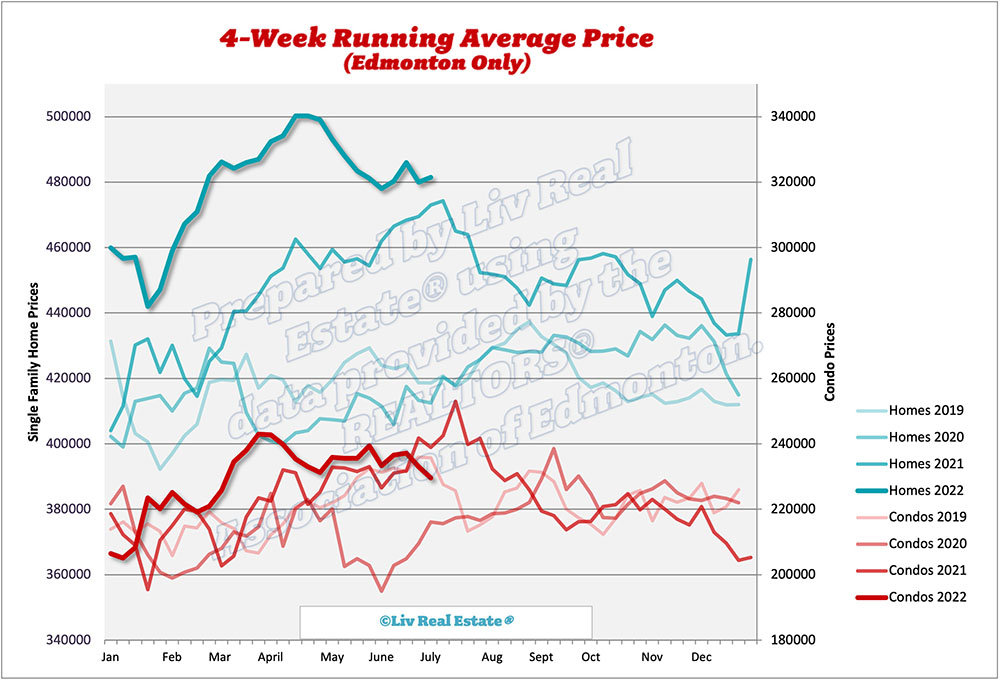
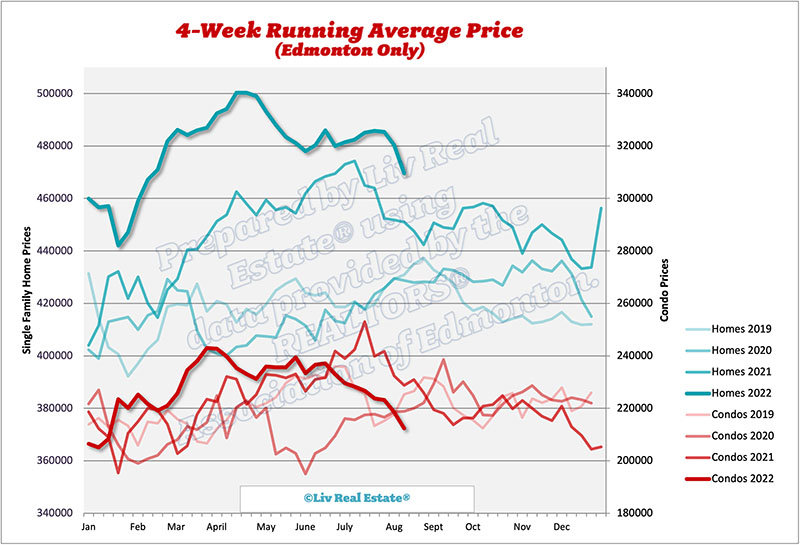
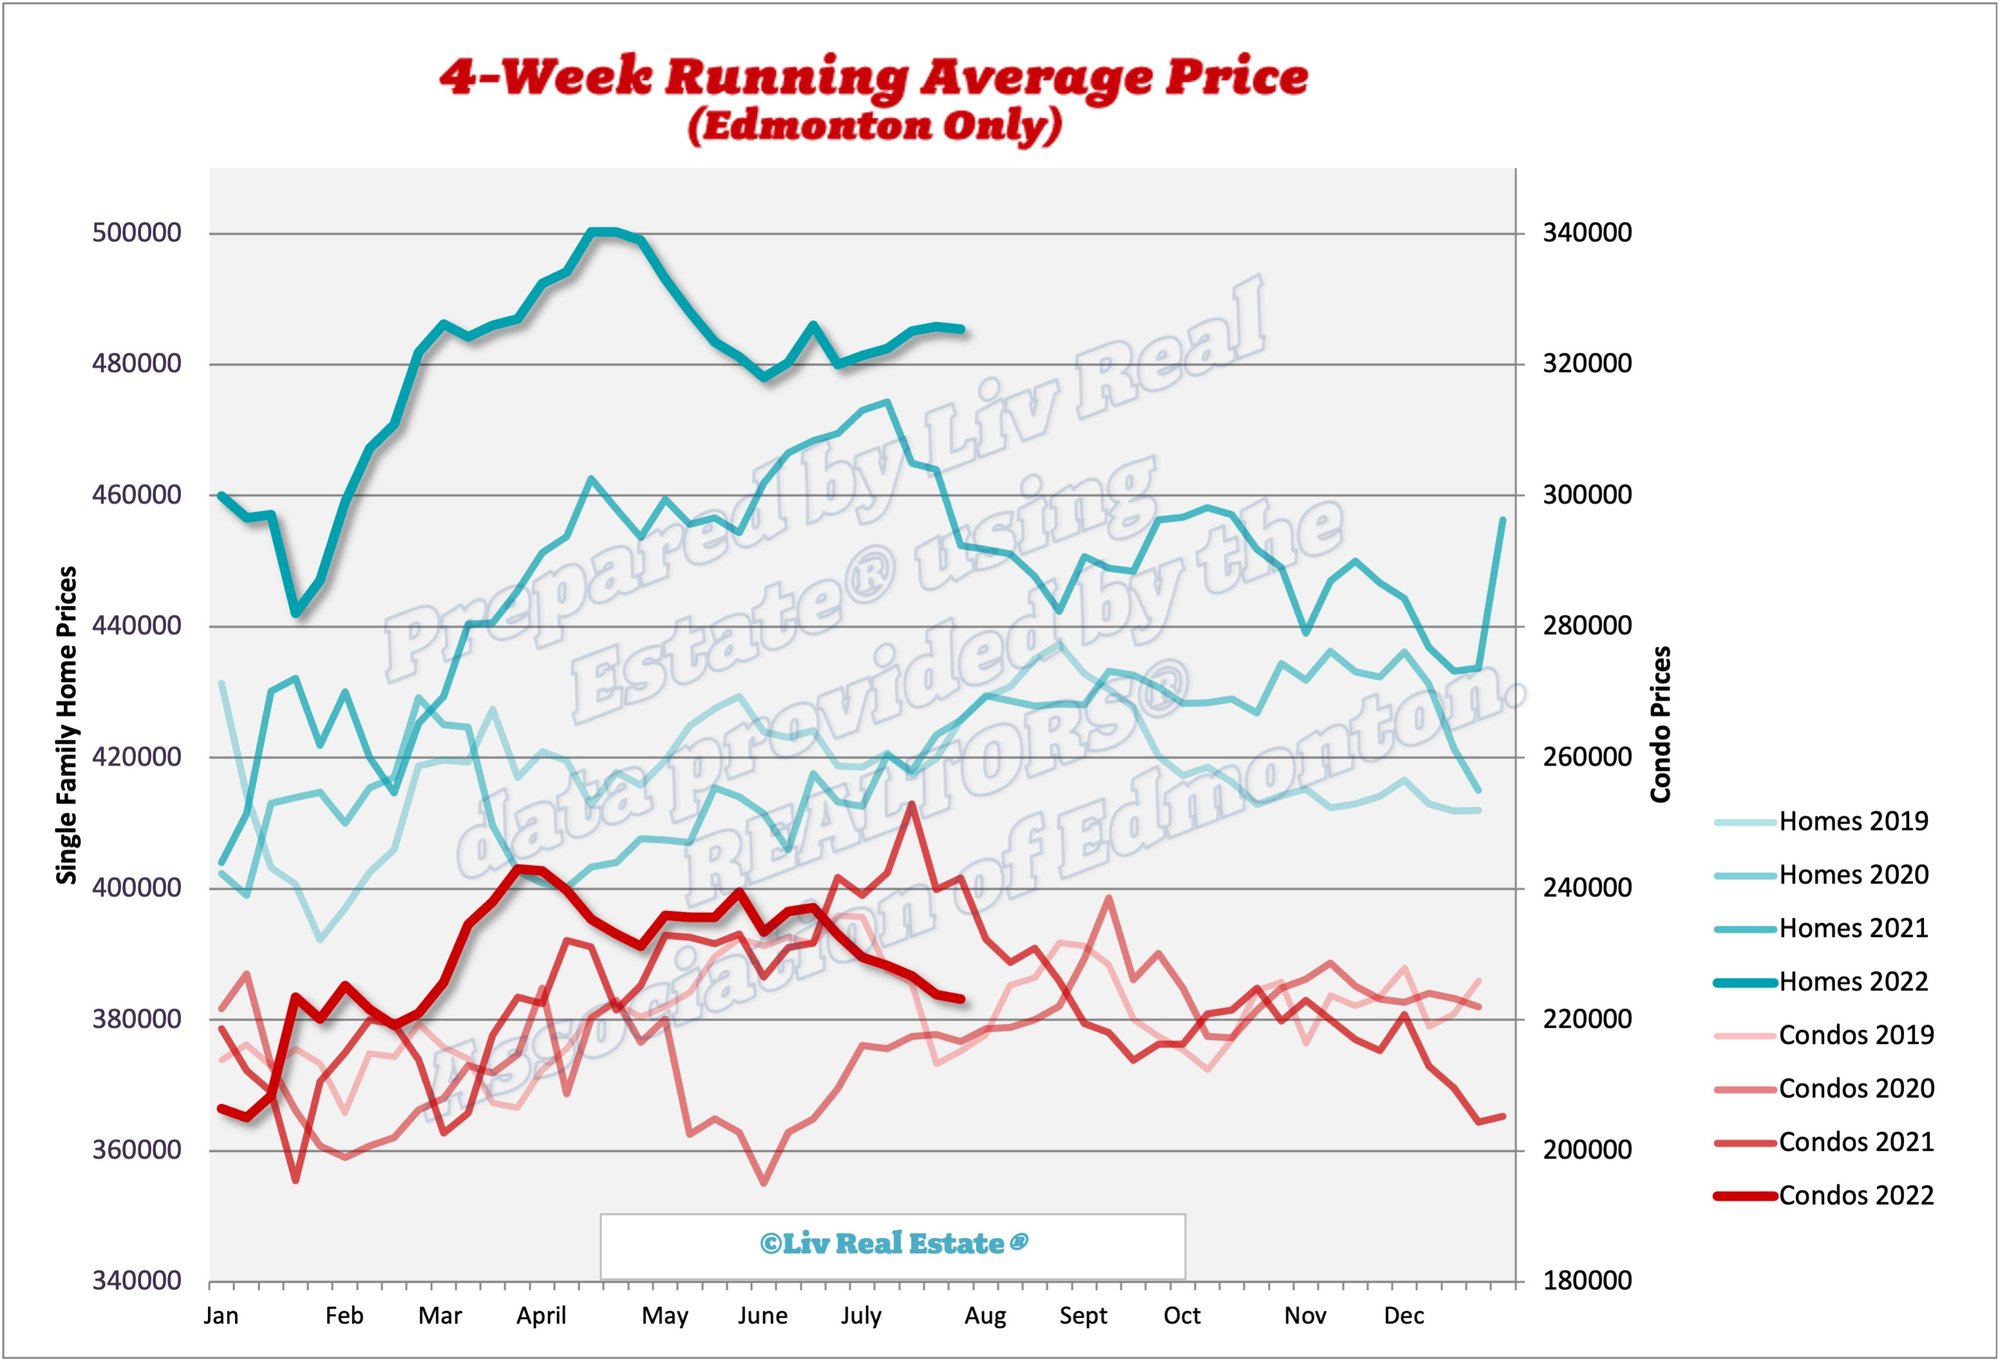
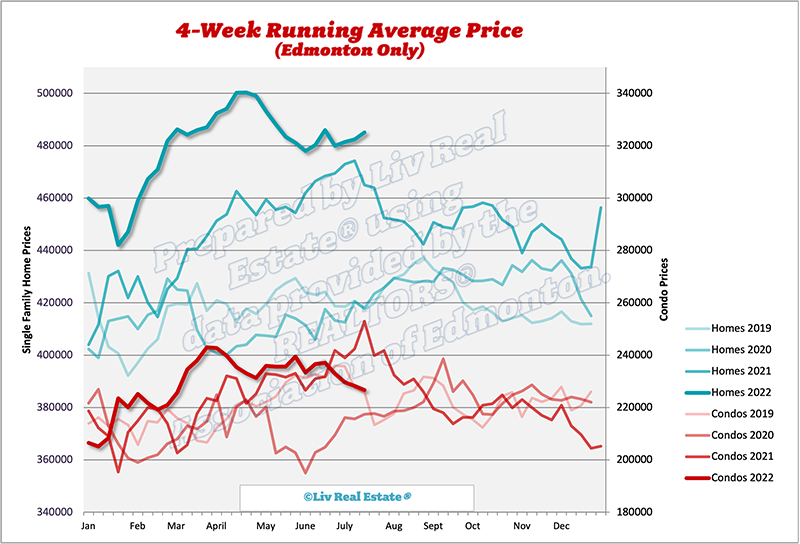
Homes 4-week running average: $463 ($470, $480, $485)
Condos 4-week running average: $215 ($212, $219, $223)

1044 Views, 5 Comments

Here is our update on the Edmonton real estate market. (Previous week’s numbers are in brackets). For the past 7 days:

New Listings: 572 (645, 617, 572)
Sales: 284 (292, 293, 333)
Ratio: 50% (45%, 47%, 58%)
Price Changes: 461 (566, 505, 569)
Expired/Off-Market Listings: 274 (296, 542, 244)
Net loss/gain in listings this week: 14 (57, -218, -5)
Active single-family home listings: 3769 (3717, 3642, 3687)
Active condo listings: 2442 (2444, 2417, 2536)
Homes 4-week running average: $470 ($480, $485, $486)
Condos 4-week running average: $212 ($219, $223, $224)

926 Views, 0 Comments

Here is our update on the Edmonton real estate market. (Previous week’s numbers are in brackets). For the past 7 days:

New Listings: 645 (617, 572, 638)
Sales: 292 (293, 333, 372)
Ratio: 45% (47%, 58%, 58%)
Price Changes: 566 (505, 569, 571)
Expired/Off-Market Listings: 296 (542, 244, 239)
Net loss/gain in listings this week: 57 (-218, -5, 27)
Active single-family home listings: 3717 (3642, 3687, 3636)
Active condo listings: 2444 (2417, 2536, 2533)
Homes 4-week running average: $480 ($485, $486, $485)
Condos 4-week running average: $219 ($223, $224, $227)

1000 Views, 0 Comments

Here is our update on the Edmonton real estate market. (Previous week’s numbers are in brackets). For the past 7 days:

New Listings: 617 (572, 638, 720)
Sales: 293 (333, 372, 385)
Ratio: 47% (58%, 58%, 53%)
Price Changes: 505 (569, 571, 654)
Expired/Off-Market Listings: 542 (244, 239, 238)
Net loss/gain in listings this week: -218 (-5, 27, 97)
Active single-family home listings: 3642 (3687, 3636, 3545)
Active condo listings: 2417 (2536, 2533, 2495)
Homes 4-week running average: $485 ($486, $485, $482)
Condos 4-week running average: $223 ($224, $227, $228)

1013 Views, 0 Comments

Sales definitely cooled off in July in the Edmonton area; single-family sales were down 3% from last July and 28% from last month, taking us back to slightly below the normal level of sales for this time of year. The average price of single-family homes increased 8.4% from last year, and the median price was up 7.4% to $437,950. I'll update this post later this week when the REALTORS® Association of Edmonton releases their monthly report on the housing market. We are now officially a balanced market for the first time since January 2021. Home sales are still up ever so slightly from last July but down 24% from last month. The cumulative days on the market have increased by 8 days, so sellers should expect their homes to sit on the market longer. Marketing…

1339 Views, 0 Comments

Here is our update on the Edmonton real estate market. (Previous week’s numbers are in brackets). For the past 7 days:

New Listings: 572 (638, 720, 646)
Sales: 333 (372, 385, 309)
Ratio: 58% (58%, 53%, 48%)
Price Changes: 569 (571, 654, 521)
Expired/Off-Market Listings: 244 (239, 238, 437)
Net loss/gain in listings this week: -5 (27, 97, -100)
Active single-family home listings: 3687 (3636, 3545, 3420)
Active condo listings: 2536 (2533, 2495, 2447)
Homes 4-week running average: $486 ($485, $482, $481)
Condos 4-week running average: $224 ($227, $228, $230)

1157 Views, 2 Comments

Here is our update on the Edmonton real estate market. (Previous week’s numbers are in brackets). For the past 7 days:

New Listings: 638 (720, 646, 681)
Sales: 372 (385, 309, 415)
Ratio: 58% (53%, 48%, 61%,)
Price Changes: 571 (654, 521, 568)
Expired/Off-Market Listings: 239 (238, 437, 412)
Net loss/gain in listings this week: 27 (97, -100, -146)
Active single-family home listings: 3636 (3545, 3420, 3376)
Active condo listings: 2533 (2495, 2447, 2382)
Homes 4-week running average: $485 ($482, $481, $480)
Condos 4-week running average: $227 ($228, $230, $233)

1063 Views, 1 Comments

Nothing says summer like ice cream on a hot day, so we’ve rounded up some of the best local spots to grab a scoop (or a swirl) in the Greater Edmonton Area this summer. 

Made By Marcus

(Brewery District & Whyte Avenue) 

Made by Marcus promises honest ingredients, innovative flavours and a superior experience. Originating in Calgary before expanding to Edmonton, Made by Marcus experiments with uncommon flavour profiles using locally sourced ingredients to create premium ice cream featuring some of the wildest flavour combinations. Each batch is built from scratch with dairy from grass-fed cows and real ingredients produced by farmers, roasters, distillers and artisans they know and trust. It’s no wonder people line up for their ice cream. 

1527 Views, 1 Comments

Here is our update on the Edmonton real estate market. (Previous week’s numbers are in brackets). For the past 7 days:

New Listings: 720 (646, 681, 700)
Sales: 385 (309, 415, 441)
Ratio: 53% (48%, 61%, 63%)
Price Changes: 654 (521, 568, 602)
Expired/Off-Market Listings: 238 (437, 412, 249)
Net loss/gain in listings this week: 97 (-100, -146, 10)
Active single-family home listings: 3545 (3420, 3376, 3331)
Active condo listings: 2495 (2447, 2382, 2499)
Homes 4-week running average: $482 ($481, $480, $486)
Condos 4-week running average: $228 ($230, $233, $237)

945 Views, 1 Comments

Here is our update on the Edmonton real estate market. (Previous week’s numbers are in brackets). For the past 7 days:

New Listings: 646 (681, 700, 776)
Sales: 309 (415, 441, 465)
Ratio: 48% (61%, 63%, 60%)
Price Changes: 521 (568, 602, 592)
Expired/Off-Market Listings: 437 (412, 249, 235)
Net loss/gain in listings this week: -100 (-146, 10, 76)
Active single-family home listings: 3420 (3376, 3331, 3257)
Active condo listings: 2447 (2382, 2499, 2410)
Homes 4-week running average: $481 ($480, $486, $480)
Condos 4-week running average: $230 ($233, $237, $237)

944 Views, 0 Comments