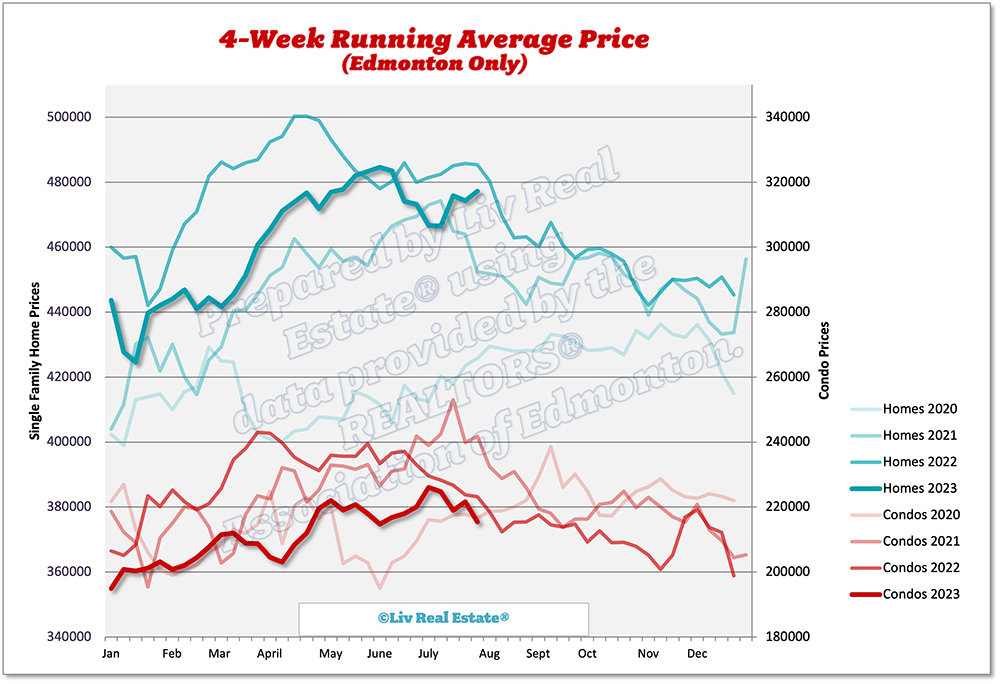
The Edmonton real estate market has been nothing short of dynamic in recent months. September 2023 shows impressive statistics that underline the city's enduring appeal. Sales in the Edmonton area surged significantly, showcasing a remarkable 31% increase over the previous September. A standout trend was the strong demand for apartment and townhouse-style condos as buyers sought affordable housing options in response to the region's increasingly competitive rental market.

One key factor fueling this surge in demand is Alberta's record-setting population growth. As more individuals and families choose to call Alberta home, the need for housing has spiked, particularly in cities like Edmonton. Consequently, this influx of newcomers has led to a robust…

1092 Views, 0 Comments

The Greater Edmonton area experienced a surge in sales this August, reaching a record high of 2250 sales. Meanwhile, inventory is at its lowest level for August since 2014, with 6768 properties available at the end of the month.

While new listings did show some improvement compared to last year, the market continues to favour sellers, with only 3 months of inventory available. Additionally, lending rates have caused buyers to delay their purchases or opt for more affordable products.

Within our brokerage, many clients who bought this past summer were new to Canada or moving from another province. Still, just as many were local buyers looking for a new home because of lifestyle changes such as marriage, divorce, children, or work. Similarly, many…

557 Views, 0 Comments

Here is our update on the Edmonton real estate market. (Previous week’s numbers are in brackets). For the past 7 days:

New Listings: 593 (543, 586, 664)
Sales: 374 (398, 457, 432)
Ratio: 63% (72%, 78%, 65%)
Price Changes: 387 (410, 393, 418)
Expired/Off-Market Listings: 356 (211, 240, 243)
Net loss/gain in listings this week: -137 (-57, -111, -11)
Active single-family home listings: 2925 (2952, 2942, 2941)
Active condo listings: 1840 (1885, 1873, 1888)
Homes 4-week running average: $477 ($474, $476, $466)
Condos 4-week running average: $215 ($222, $219, $225)

525 Views, 0 Comments

Here is our update on the Edmonton real estate market. (Previous week’s numbers are in brackets). For the past 7 days:

New Listings: 543 (586, 664, 602)
Sales: 398 (457, 432, 379)
Ratio: 72% (78%, 65%, 63%)
Price Changes: 410 (393, 418, 371)
Expired/Off-Market Listings: 211 (240, 243, 395)
Net loss/gain in listings this week: -57 (-111, -11, -172)
Active single-family home listings: 2952 (2942, 2941, 2905)
Active condo listings: 1885 (1873, 1888, 1877)
Homes 4-week running average: $474 ($476, $466, $467)
Condos 4-week running average: $222 ($219, $225, $226)


583 Views, 0 Comments

Here is our update on the Edmonton real estate market. (Previous week’s numbers are in brackets). For the past 7 days:

New Listings: 586 (664, 602, 516)
Sales: 457 (432, 379, 411)
Ratio: 78% (65%, 63%, 80%)
Price Changes: 393 (418, 371, 398)
Expired/Off-Market Listings: 240 (243, 395, 179)
Net loss/gain in listings this week: -111 (-11, -172, -74)
Active single-family home listings: 2942 (2941, 2905, 2976)
Active condo listings: 1873 (1888, 1877, 1914)
Homes 4-week running average: $476 ($466, $467, $473)
Condos 4-week running average: $219 ($225, $226, $220)

610 Views, 2 Comments

Here is our update on the Edmonton real estate market. (Previous week’s numbers are in brackets). For the past 7 days:

New Listings: 664 (602, 516, 526)
Sales: 432 (379, 411, 430)
Ratio: 65% (63%, 80%, 82%)
Price Changes: 418 (371, 398, 344)
Expired/Off-Market Listings: 243 (395, 179, 203)
Net loss/gain in listings this week: -11 (-172, -74, -107)
Active single-family home listings: 2941 (2905, 2976, 2958)
Active condo listings: 1888 (1877, 1914, 1917)
Homes 4-week running average: $466 ($467, $473, $474)
Condos 4-week running average: $225 ($226, $220, $218)

567 Views, 0 Comments

Here is our update on the Edmonton real estate market. (Previous week’s numbers are in brackets). For the past 7 days:

New Listings: 602 (516, 526, 606)
Sales: 379 (411, 430, 433)
Ratio: 63% (80%, 82%, 71%)
Price Changes: 371 (398, 344, 403)
Expired/Off-Market Listings: 395 (179, 203, 179)
Net loss/gain in listings this week: -172 (-74, -107, -6)
Active single-family home listings: 2905 (2976, 2958, 2973)
Active condo listings: 1877 (1914, 1917, 1919)
Homes 4-week running average: $467 ($473, $474, $484)
Condos 4-week running average: $226 ($220, $218, $217)

562 Views, 2 Comments

Here's something we haven't said in a while... apartment-style condo sales took a major leap in June - they were up 26% from last June. Net migration to Alberta has reached new all-time highs, with almost 150,000 people moving to the province between June 2022 and March 2023. Approximately 2/3 of these new migrants are international, and this is creating very high demand for rental properties. As a result, there has been increased interest in condo-style apartments. Apartment prices have been on the decline for years in Edmonton, and although we're not seeing a year-over-year increase in the benchmark price yet, it does appear as though apartment prices may have bottomed out in January of this year. 

Listing inventory is now well below normal levels,…

939 Views, 0 Comments

Here is our update on the Edmonton real estate market. (Previous week’s numbers are in brackets). For the past 7 days:

New Listings: 516 (526, 606, 664)
Sales: 411 (430, 433, 425)
Ratio: 80% (82%, 71%, 64%)
Price Changes: 398 (344, 403, 415)
Expired/Off-Market Listings: 179 (203, 179, 198)
Net loss/gain in listings this week: -74 (-107, -6, 41)
Active single-family home listings: 2976 (2958, 2973, 2994)
Active condo listings: 1914 (1917, 1919, 1857)
Homes 4-week running average: $473 ($474, $484, $485)
Condos 4-week running average: $220 ($218, $217, $215)


574 Views, 1 Comments

Here is our update on the Edmonton real estate market. (Previous week’s numbers are in brackets). For the past 7 days:

New Listings: 526 (606, 664, 615)
Sales: 430 (433, 425, 413)
Ratio: 82% (71%, 64%, 67%)
Price Changes: 344 (403, 415, 459)
Expired/Off-Market Listings: 203 (179, 198, 331)
Net loss/gain in listings this week: -107 (-6, 41, -129)
Active single-family home listings: 2958 (2973, 2994, 2903)
Active condo listings: 1917 (1919, 1857, 1814)
Homes 4-week running average: $474 ($484, $485, $483)
Condos 4-week running average: $218 ($217, $215, $218)

592 Views, 2 Comments