Here is our update on the Edmonton real estate market. (Previous week’s numbers are in brackets). For the past 7 days:

New Listings: 500 (533, 604, 503)
Sales: 411 (419, 457, 341)
Ratio: 82% (79%, 76%, 68%)
Price Changes: 358 (344, 362, 327)
Expired/Off-Market Listings: 417 (203, 263, 196)
Net loss/gain in listings this week: -328 (-89, -116, -34)
Active single-family home listings: 2827 (2976, 2938, 2942)
Active condo listings: 1698 (1823, 1827, 1811)
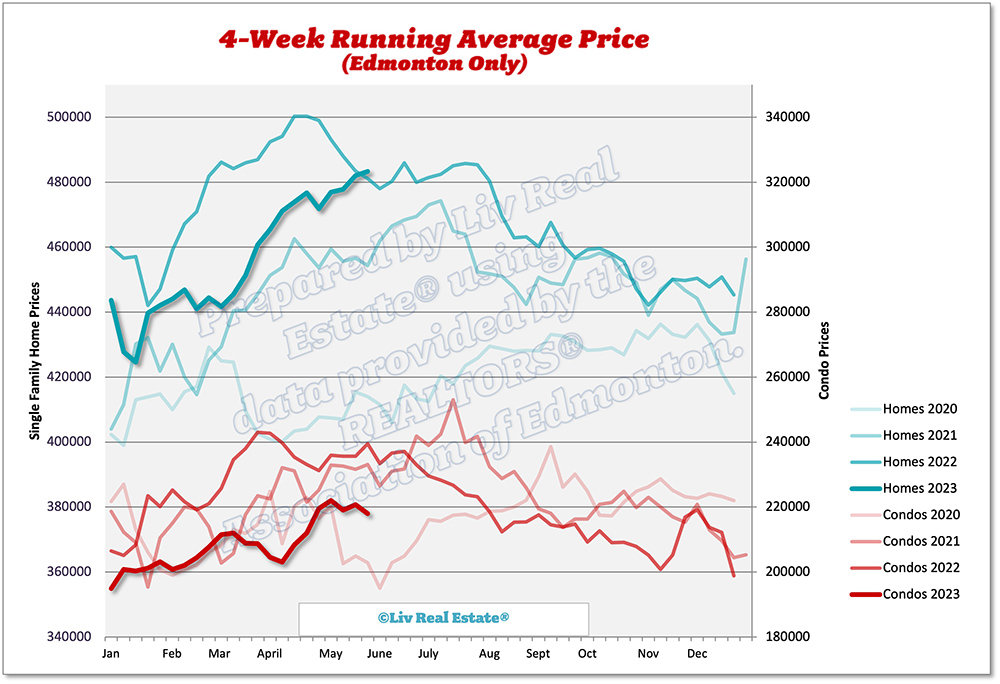
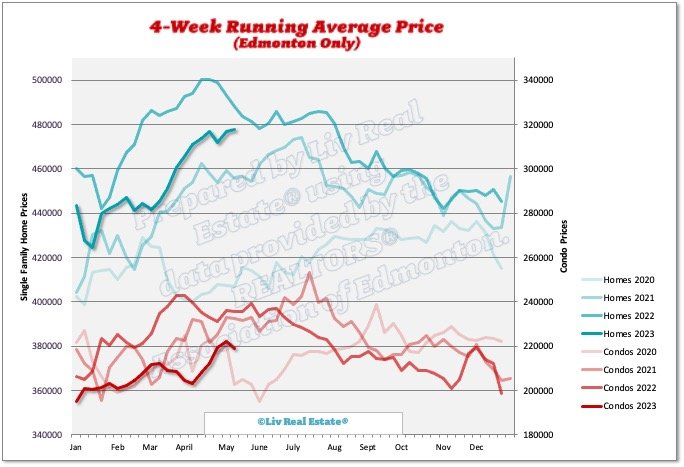
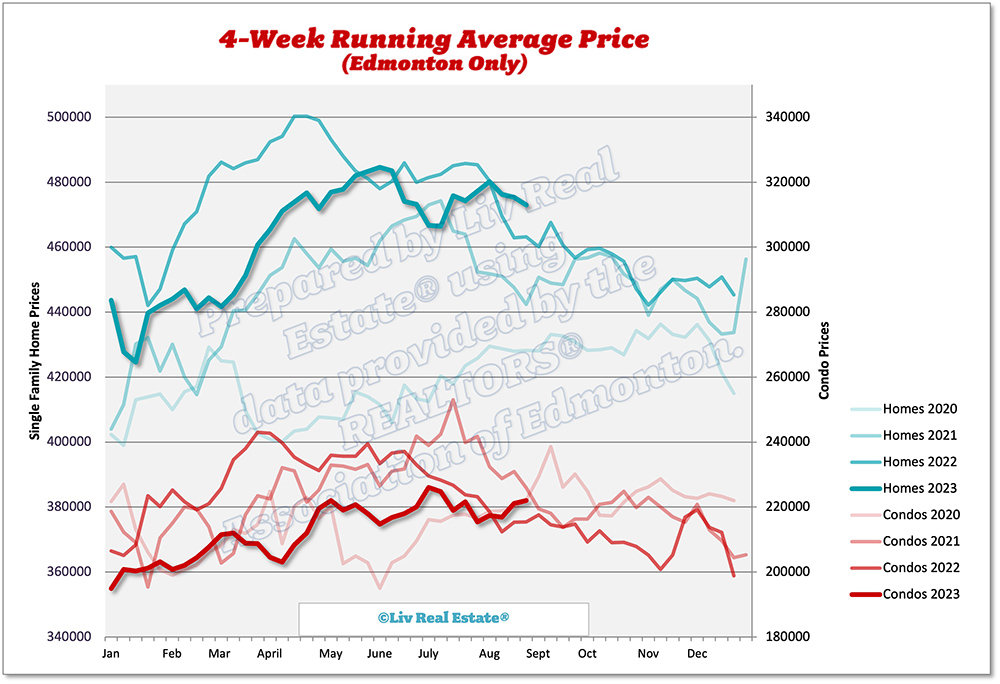
Homes 4-week running average: $473 ($475, $476, $480)
Condos 4-week running average: $222 ($221, $217, $217)


390 Views, 0 Comments

Here is our update on the Edmonton real estate market. (Previous week’s numbers are in brackets). For the past 7 days:

New Listings: 533 (604, 503, 593)
Sales: 419 (457, 341, 374)
Ratio: 79% (76%, 68%, 63%)
Price Changes: 344 (362, 327, 387)
Expired/Off-Market Listings: 203 (263, 196, 356)
Net loss/gain in listings this week: -89 (-116, -34, -137)
Active single-family home listings: 2976 (2938, 2942, 2925)
Active condo listings: 1823 (1827, 1811, 1840)
Homes 4-week running average: $475 ($476, $480, $477)
Condos 4-week running average: $221 ($217, $217, $215)

419 Views, 0 Comments

While some may exclaim, "Now's a great time to buy!” we advise you to be cautious of those people. This isn’t to say it’s not or can’t be a good time to buy, just that a good time to buy looks different for everyone, and it's essential to evaluate your personal circumstances. The prevailing high interest rates, unyielding prices, and limited housing inventory can make the idea of homeownership daunting, but the right real estate professional can help you navigate the market and reach your real estate goals. In this blog post, we will explore the three key considerations to help determine whether or not it's a good time for you to buy a home.

1. Start with Monthly Payment:

When considering homeownership, begin by looking at what you can afford for a…

409 Views, 0 Comments

Here is our update on the Edmonton real estate market. (Previous week’s numbers are in brackets). For the past 7 days:

New Listings: 604 (503, 593, 543)
Sales: 457 (341, 374, 398)
Ratio: 76% (68%, 63%, 72%)
Price Changes: 362 (327, 387, 410)
Expired/Off-Market Listings: 263 (196, 356, 211)
Net loss/gain in listings this week: -116 (-34, -137, -57)
Active single-family home listings: 2938 (2942, 2925, 2952)
Active condo listings: 1827 (1811, 1840, 1885)
Homes 4-week running average: $476 ($480, $477, $474)
Condos 4-week running average: $217 ($217, $215, $222)

351 Views, 0 Comments

Active listings were down 16% from July 2022, while sales were up 18% leaving us in a strong seller's market. However, we aren't seeing the same spike in prices that you would expect from a seller's market due to the higher interest rates. In fact, the benchmark price for all categories was down compared to July 2022, with the composite down 6%. 


City of Edmonton Stats

Below are the statistics for Edmonton Proper, showing both single-family and condo sales at a high since 2015, when comparing July 2023 to July years previous.


396 Views, 0 Comments

Here is our update on the Edmonton real estate market. (Previous week’s numbers are in brackets). For the past 7 days:

New Listings: 503 (593, 543, 586)
Sales: 341 (374, 398, 457)
Ratio: 68% (63%, 72%, 78%)
Price Changes: 327 (387, 410, 393)
Expired/Off-Market Listings: 196 (356, 211, 240)
Net loss/gain in listings this week: -34 (-137, -57, -111)
Active single-family home listings: 2942 (2925, 2952, 2942)
Active condo listings: 1811 (1840, 1885, 1873)
Homes 4-week running average: $480 ($477, $474, $476)
Condos 4-week running average: $217 ($215, $222, $219)

397 Views, 0 Comments

Here is our update on the Edmonton real estate market. (Previous week’s numbers are in brackets). For the past 7 days:

New Listings: 615 (603, 649, 661)
Sales: 413 (420, 493, 422)
Ratio: 67% (70%, 76%, 64%)
Price Changes: 459 (390, 395, 351)
Expired/Off-Market Listings: 331 (174, 194, 202)
Net loss/gain in listings this week: -129 (9, -38, 37)
Active single-family home listings: 2903 (2940, 2901, 2839)
Active condo listings: 1814 (1841, 1836, 1795)
Homes 4-week running average: $483 ($482, $478, $477)
Condos 4-week running average: $218 ($221, $219, $222)

596 Views, 2 Comments

Here is our update on the Edmonton real estate market. (Previous week’s numbers are in brackets). For the past 7 days:

New Listings: 603 (649, 661, 633)
Sales: 420 (493, 422, 434)
Ratio: 70% (76%, 64%, 69%)
Price Changes: 390 (395, 351, 373)
Expired/Off-Market Listings: 174 (194, 202, 308)
Net loss/gain in listings this week: 9 (-38, 37, -109)
Active single-family home listings: 2940 (2901, 2839, 2791)
Active condo listings: 1841 (1836, 1795, 1747)
Homes 4-week running average: $482 ($478, $477, $472)
Condos 4-week running average: $221 ($219, $222, $220)


518 Views, 1 Comments

Here is our update on the Edmonton real estate market. (Previous week’s numbers are in brackets). For the past 7 days:

New Listings: 649 (661, 633, 580)
Sales: 493 (422, 434, 396)
Ratio: 76% (64%, 69%, 68%)
Price Changes: 395 (351, 373, 345)
Expired/Off-Market Listings: 194 (202, 308, 155)
Net loss/gain in listings this week: -38 (37, -109, 29)
Active single-family home listings: 2901 (2839, 2791, 2859)
Active condo listings: 1836 (1795, 1747, 1744)
Homes 4-week running average: $478 ($477, $472, $477)
Condos 4-week running average: $219 ($222, $220, $212)

426 Views, 1 Comments

Here is our update on the Edmonton real estate market. (Previous week’s numbers are in brackets). For the past 7 days:

New Listings: 661 (633, 580, 696)
Sales: 422 (434, 396, 427)
Ratio: 64% (69%, 68%, 61%)
Price Changes: 351 (373, 345, 319)
Expired/Off-Market Listings: 202 (308, 155, 181)
Net loss/gain in listings this week: 37 (-109, 29, 88)
Active single-family home listings: 2839 (2791, 2859, 2820)
Active condo listings: 1795 (1747, 1744, 1721)
Homes 4-week running average: $477 ($472, $477, $474)
Condos 4-week running average: $222 ($220, $212, $208)

516 Views, 0 Comments