Here’s your latest look at what’s happening in the Edmonton real estate market over the past 7 days, with trends continuing to reveal a market that remains active and competitive. (Previous week's numbers are in brackets). 

New Listings: 580 (690, 653, 515)
Sales: 330 (344, 285, 308)
Ratio: 57% (50%, 44%, 60%)
Price Changes: 299 (251, 224, 226)
Expired/Off-Market Listings: 176 (153, 262, 152)
Net loss/gain in listings this week: 74 (193, 106, 55)
Active single-family home listings: 2493 (2452, 2307, 2232)
Active condo listings: 1662 (1613, 1546, 1493)
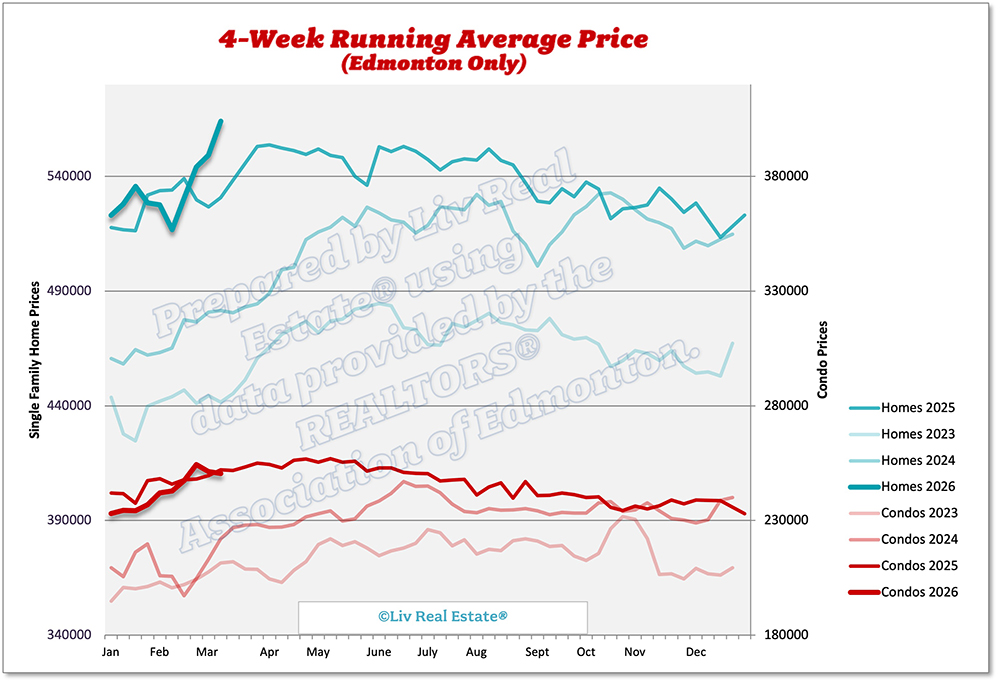
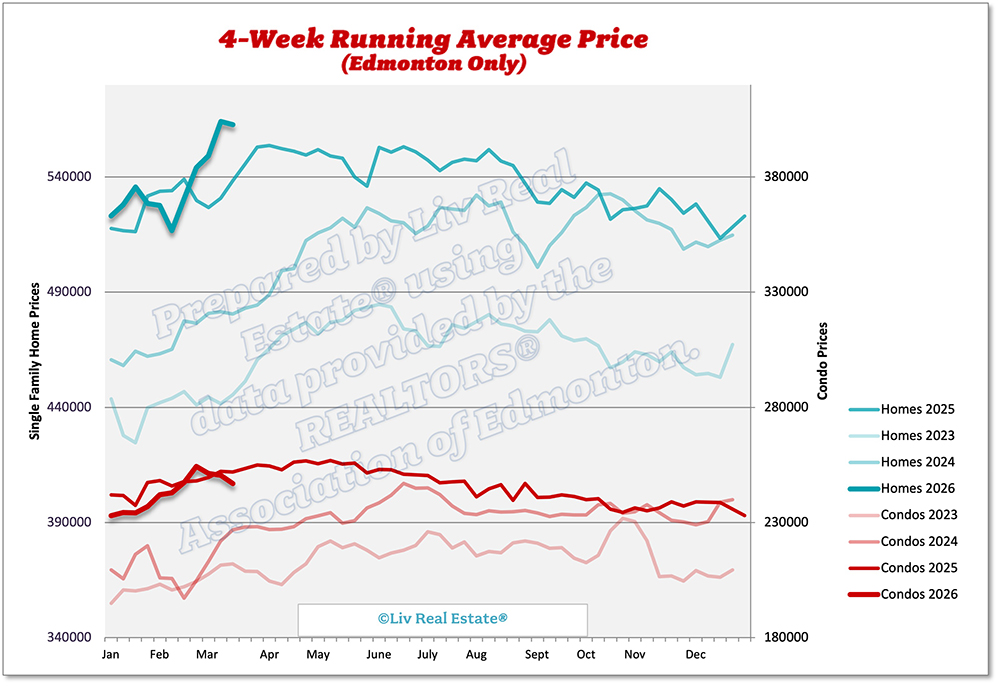
Homes 4-week running average: $566 ($563, $564, $549)
Condos 4-week running average: $244 ($247, $251, $251)

There are some subtle shifts worth noting:

  • Even with fewer listings and sales, the higher ratio…

485 Views, 0 Comments
Here is our weekly update on the Edmonton real estate market for the past 7 days: (Previous week's numbers are in brackets). 

New Listings: 690 (653, 515, 534)
Sales: 344 (285, 308, 314)
Ratio: 50% (44%, 60%, 58%)
Price Changes: 251 (224, 226, 172)
Expired/Off-Market Listings: 153 (262, 152, 180)
Net loss/gain in listings this week: 193 (106, 55, 49)
Active single-family home listings: 2452 (2307, 2232, 2133)
Active condo listings: 1613 (1546, 1493, 1495)
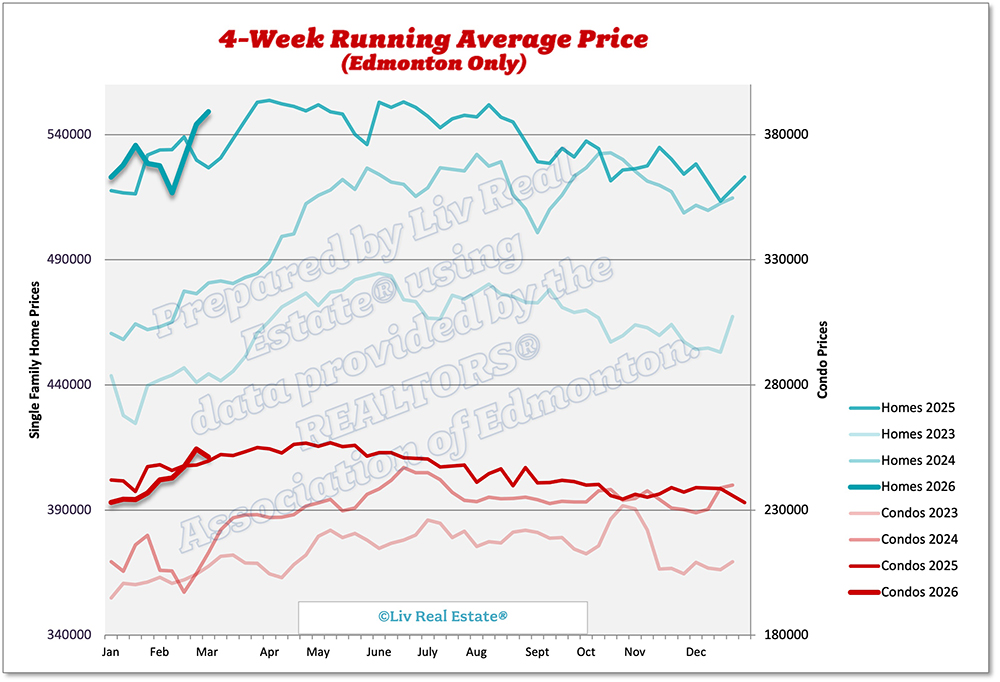
Homes 4-week running average: $563 ($564, $549, $544)
Condos 4-week running average: $247 ($251, $251, $254)

313 Views, 0 Comments

Here is our weekly update on the Edmonton real estate market for the past 7 days: (Previous week's numbers are in brackets). 

New Listings: 653 (515, 534, 589)
Sales: 285 (308, 314, 305)
Ratio: 44% (60%, 58%, 52%)
Price Changes: 224 (226, 172, 174)
Expired/Off-Market Listings: 262 (152, 180, 194)
Net loss/gain in listings this week: 106 (55, 49, 90)
Active single-family home listings: 2307 (2232, 2133, 2075)
Active condo listings: 1546 (1493, 1495, 1446)
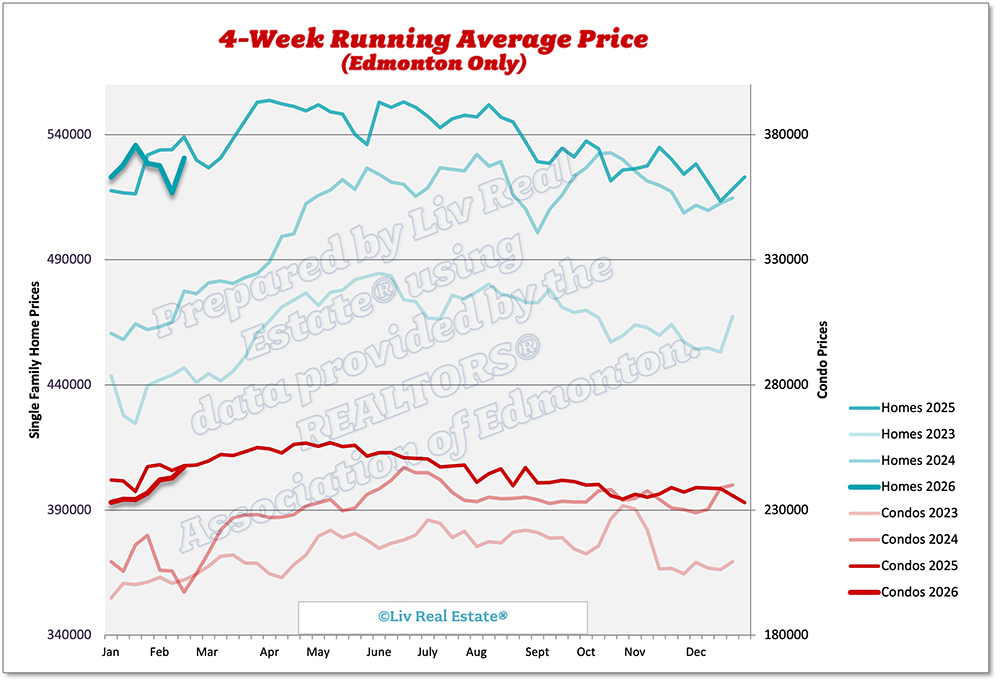
Homes 4-week running average: $564 ($549, $544, $531)
Condos 4-week running average: $251 ($251, $254, $247)

311 Views, 0 Comments

The Greater Edmonton real estate market began 2026 with a noticeable shift from the unusually strong conditions seen a year earlier. Sales activity picked up in February but remained down 12% from last year. Supply edged higher, leading to more balanced conditions.

Residential sales totalled 1,606, down roughly 12% from February 2025. Meanwhile, new listings rose slightly to 3,020, about 11% higher than a year earlier. This pushed the inventory up to 3.4 months of supply, signalling that the intense competition seen through much of 2025 has eased. The benchmark price for single-family homes dipped by 1% to $513,700, while townhouses dropped by 4.5% and apartments by 4% year over year. While the average and median prices for single-family homes are…

832 Views, 0 Comments

Here is our weekly update on the Edmonton real estate market for the past 7 days: (Previous week's numbers are in brackets). 

New Listings: 515 (534, 589, 587)
Sales: 308 (314, 305, 271)
Ratio: 60% (58%, 52%, 46%)
Price Changes: 226 (172, 174, 202)
Expired/Off-Market Listings: 152 (180, 194, 348)
Net loss/gain in listings this week: 55 (49, 90, -32)
Active single-family home listings: 2232 (2133, 2075, 2015)
Active condo listings: 1493 (1495, 1446, 1395)
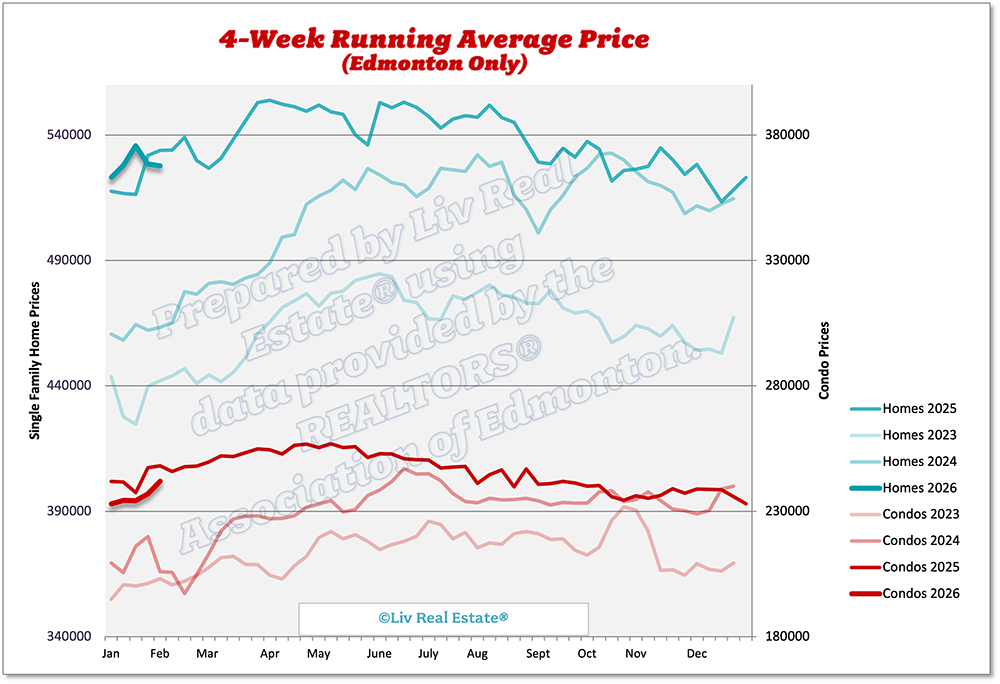
Homes 4-week running average: $549 ($544, $531, $517)
Condos 4-week running average: $251 ($254, $247, $243)

305 Views, 0 Comments

Here is our weekly update on the Edmonton real estate market for the past 7 days: (Previous week's numbers are in brackets). 

New Listings: 534 (589, 587, 450)
Sales: 314 (305, 271, 208)
Ratio: 58% (52%, 46%, 46%)
Price Changes: 172 (174, 202, 171)
Expired/Off-Market Listings: 180 (194, 348, 169)
Net loss/gain in listings this week: 49 (90, -32, 73)
Active single-family home listings: 2133 (2075, 2015, 2027)
Active condo listings: 1495 (1446, 1395, 1400)
Homes 4-week running average: $544 ($531, $517, $528)
Condos 4-week running average: $254 ($247, $243, $242)

437 Views, 0 Comments

Here is our weekly update on the Edmonton real estate market for the past 7 days: (Previous week's numbers are in brackets). 

New Listings: 589 (587, 450, 380)
Sales: 305 (271, 208, 212)
Ratio: 52% (46%, 46%, 56%)
Price Changes: 174 (202, 171, 286)
Expired/Off-Market Listings: 194 (348, 169, 170)
Net loss/gain in listings this week: 90 (-32, 73, -2)
Active single-family home listings: 2075 (2015, 2027, 1970)
Active condo listings: 1446 (1395, 1400, 1401)
Homes 4-week running average: $531 ($517, $528, $528)
Condos 4-week running average: $247 ($243, $242, $237)

416 Views, 0 Comments

Here is our weekly update on the Edmonton real estate market for the past 7 days: (Previous week's numbers are in brackets). 

New Listings: 587 (450, 380, 449)
Sales: 271 (208, 212, 209)
Ratio: 46% (46%, 56%, 47%)
Price Changes: 202 (171, 286, 144)
Expired/Off-Market Listings: 348 (169, 170, 193)
Net loss/gain in listings this week: -32 (73, -2, 47)
Active single-family home listings: 2015 (2027, 1970, 2016)
Active condo listings: 1395 (1400, 1401, 1352)
Homes 4-week running average: $517 ($528, $528, $536)
Condos 4-week running average: $243 ($242, $237, $234)

327 Views, 0 Comments

The Greater Edmonton real estate market began 2026 with a clear moderation in activity compared to the unusually strong start to 2025. January recorded 1,151 residential sales, down 28 % year over year, while new listings increased modestly to 2,512, up 5 % from January 2025. This shift pushed the sales-to-new-listings ratio down to 46 %, from 66 % a year earlier, signalling a move toward more balanced market conditions.

Despite softer sales, prices rose modestly. The average residential sale price reached $448,761, up 2.5 % year over year, while the median price rose to $430,000, a 3.0 % increase. With a 3 % increase in new listings, inventory levels increased significantly. Active residential listings at month-end rose to 4,881 units, up 32 % from…

1299 Views, 0 Comments

Here is our weekly update on the Edmonton real estate market for the past 7 days: (Previous week's numbers are in brackets). 

New Listings: 450 (380, 449, 443)
Sales: 208 (212, 209, 182)
Ratio: 46% (56%, 47%, 41%)
Price Changes: 171 (286, 144, 188)
Expired/Off-Market Listings: 169 (170, 193, 194)
Net loss/gain in listings this week: 73 (-2, 47, 67)
Active single-family home listings: 2027 (1970, 2016, 1979)
Active condo listings: 1400 (1401, 1352, 1319)
Homes 4-week running average: $528 ($528, $536, $528)
Condos 4-week running average: $242 ($237, $234, $234)

324 Views, 0 Comments