The REALTORS® Association of Edmonton recently held its annual housing forecast, giving us insights into what to expect in the Greater Edmonton area housing market in 2026. The consensus for the day was that Edmonton’s real estate market is entering a new phase — one defined less by rapid price acceleration and more by steady demand, balanced conditions, and the supportive backdrop of Alberta’s broader economic trends.

Troy Paquette, the Association's Chair-Elect, started the day off by looking back at 2025, which marked a year of recalibration for the Greater Edmonton real estate market. Activity cooled from the extraordinary highs of the post-pandemic period as migration slowed, inventory began to rise, and economic uncertainty tempered buyer demand.…

3679 Views, 0 Comments

Here is our weekly update on the Edmonton real estate market for the past 7 days: (Previous week's numbers are in brackets). 

New Listings: 380 (449, 443, 157)
Sales: 212 (209, 182, 116)
Ratio: 56% (47%, 41%, 74%)
Price Changes: 286 (144, 188, 58)
Expired/Off-Market Listings: 170 (193, 194, 504)
Net loss/gain in listings this week: -2 (47, 67, -463)
Active single-family home listings: 1970 (2016, 1979, 1901)
Active condo listings: 1401 (1352, 1319, 1289)
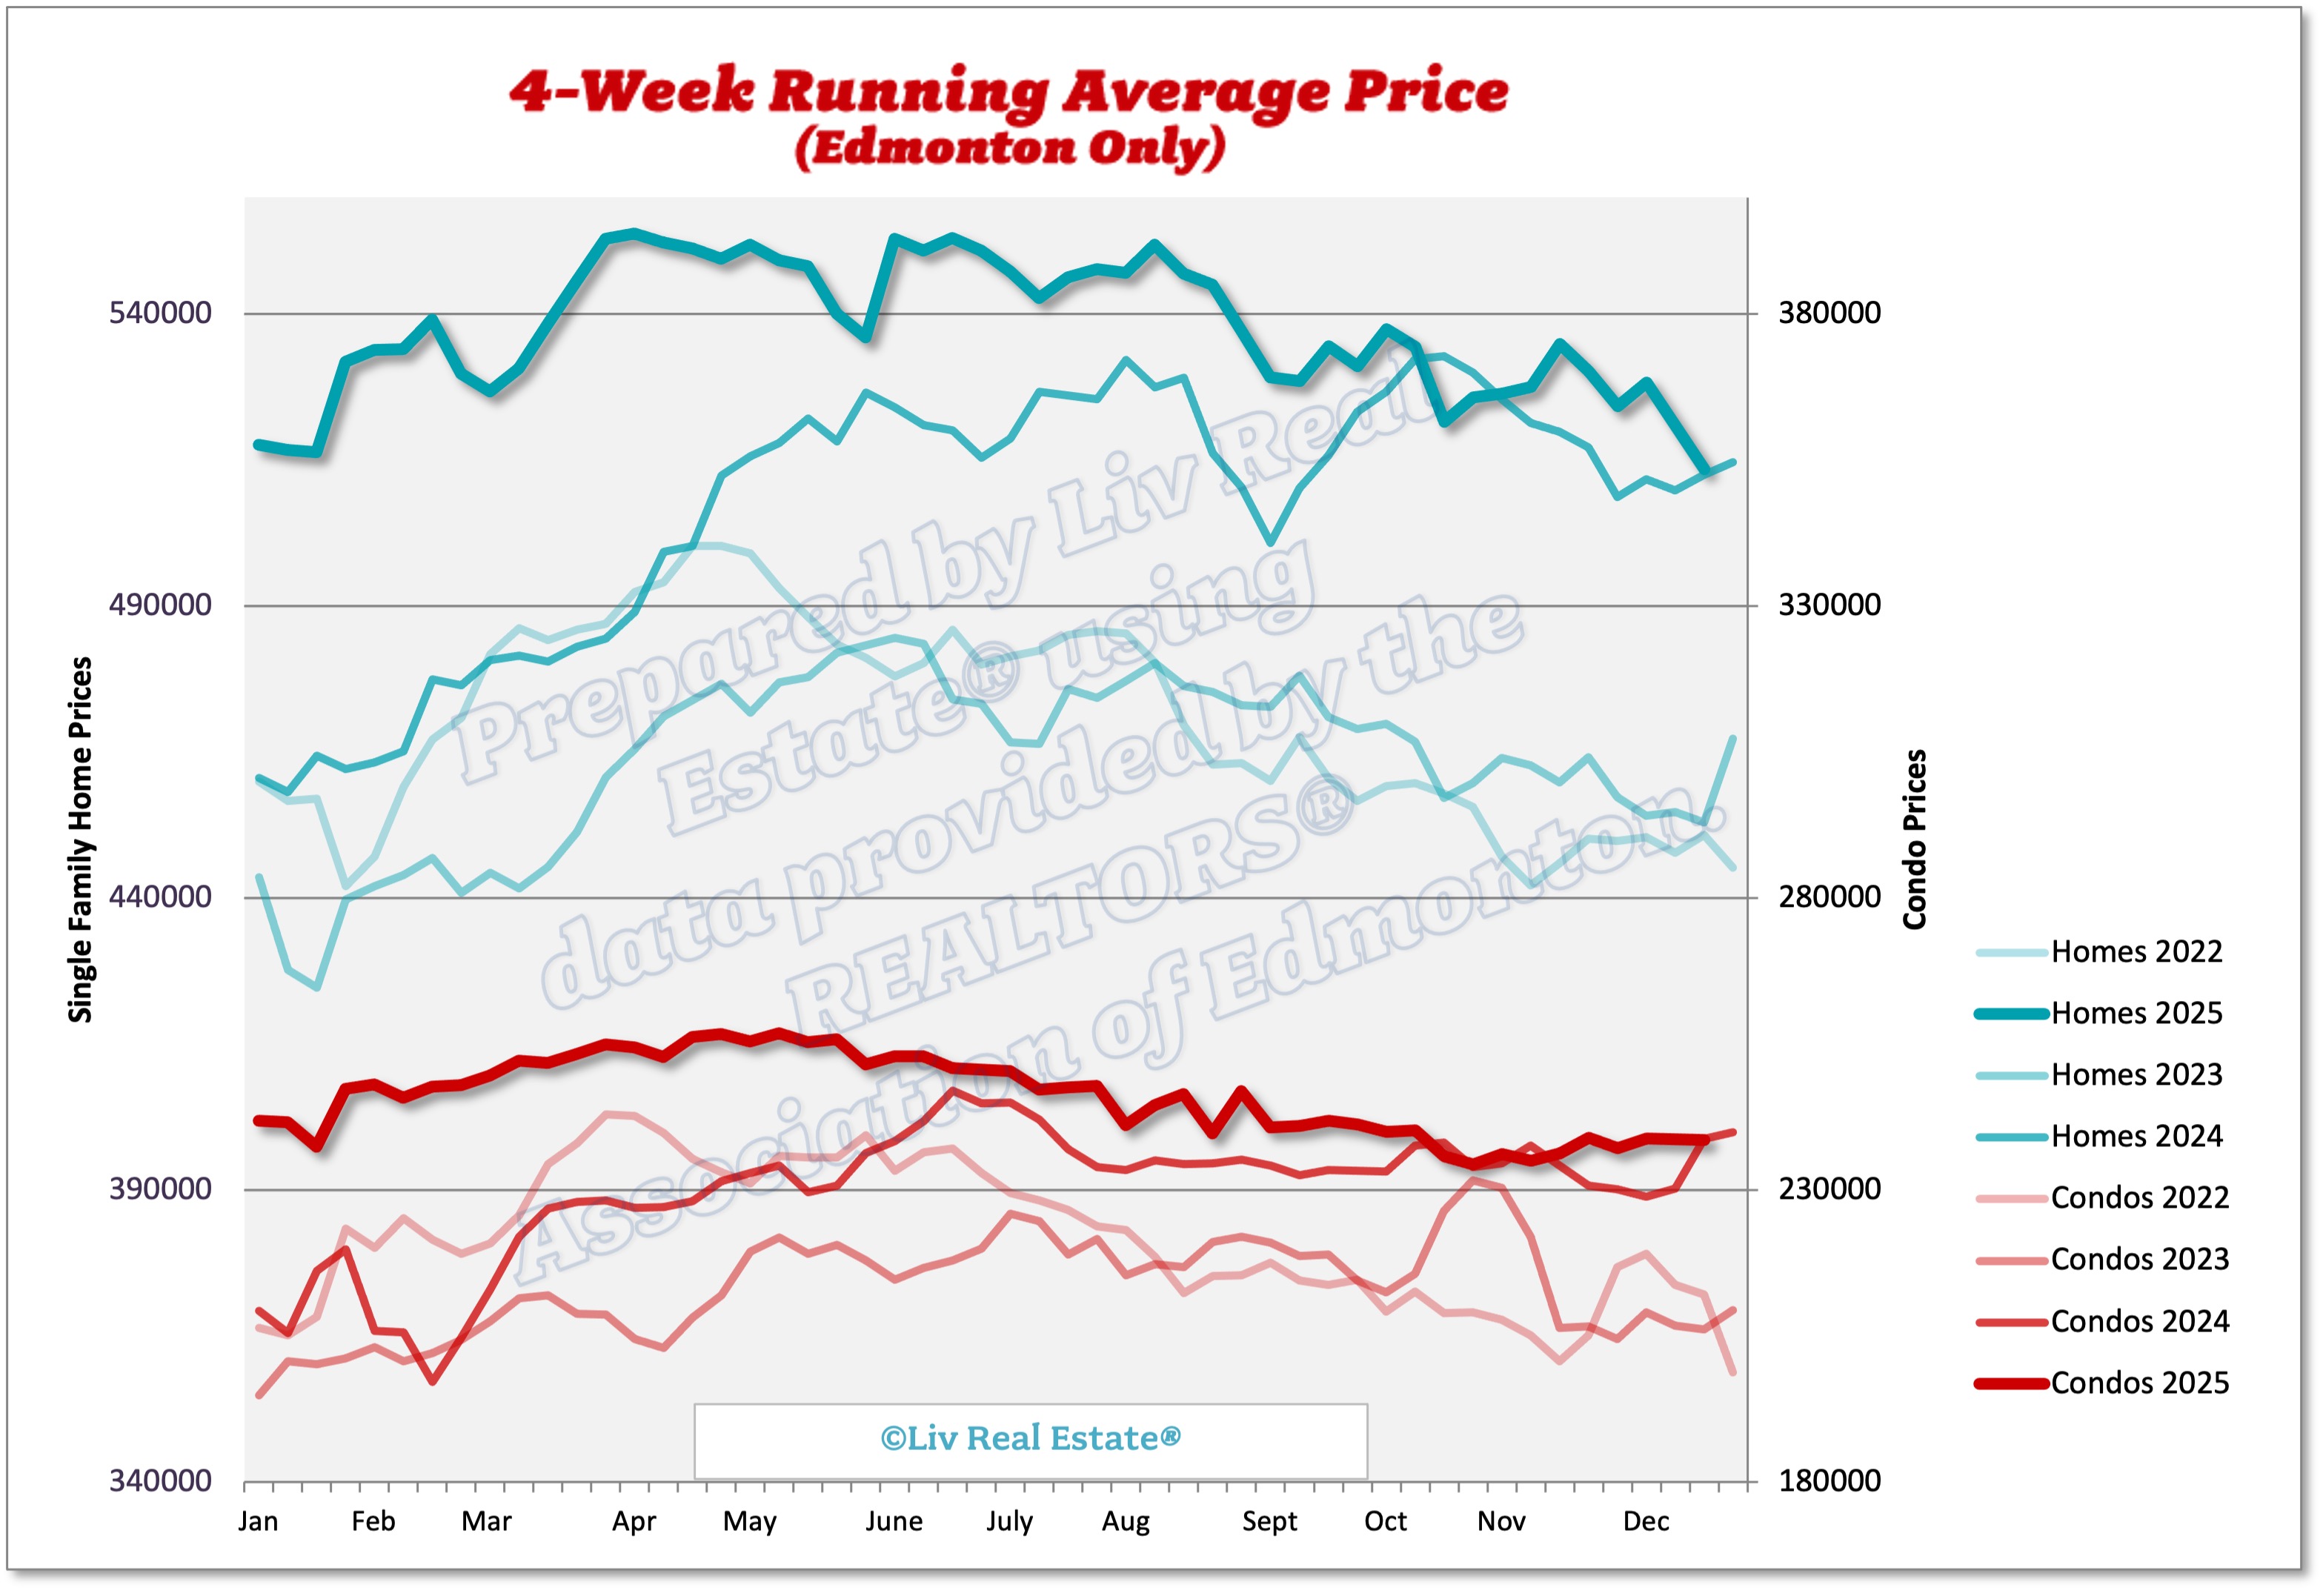
Homes 4-week running average: $528 ($536, $528, $523)
Condos 4-week running average: $237 ($234, $234, $233)

325 Views, 0 Comments

Here is our weekly update on the Edmonton real estate market for the past 7 days: (Previous week's numbers are in brackets). 

New Listings: 449 (443, 157, 229)
Sales: 209 (182, 116, 244)
Ratio: 47% (41%, 74%, 107%)
Price Changes: 144 (188, 58, 211)
Expired/Off-Market Listings: 193 (194, 504, 227)
Net loss/gain in listings this week: 47 (67, -463, -242)
Active single-family home listings: 2016 (1979, 1901, 2288)
Active condo listings: 1352 (1319, 1289, 1516)
Homes 4-week running average: $536 ($528, $523, $513)
Condos 4-week running average: $234 ($234, $233, $239)

336 Views, 0 Comments

Here is our weekly update on the Edmonton real estate market for the past 7 days: (Previous week's numbers are in brackets). 

New Listings: 443 (157, 229, 345)
Sales: 182 (116, 244, 256)
Ratio: 41% (74%, 107%, 74%)
Price Changes: 188 (58, 211, 219)
Expired/Off-Market Listings: 194 (504, 227, 425)
Net loss/gain in listings this week: 67 (-463, -242, -336)
Active single-family home listings: 1979 (1901, 2288, 2464)
Active condo listings: 1319 (1289, 1516, 1601)
Homes 4-week running average: $528 ($523, $513, $528)
Condos 4-week running average: $234 ($233, $239, $239)

332 Views, 0 Comments

The Greater Edmonton real estate market closed 2025 from a position of strength, even as conditions began to normalize. A total of 26,835 homes sold in the Edmonton area in 2025, down 6% from 2024 but still above levels seen in 2021 through 2023. With a total of 39,381 listings, an 8% year-over-year increase, buyers had more to choose from in 2025. Despite this, inventory remained below long-term norms for much of the year, sustaining seller-favourable conditions across most property types.

Prices continued to advance at a measured but healthy pace. The annual average single-family home price rose 6.4% to $570,045, while townhouses increased 4.8% to $304,553 and apartment condominiums gained 5.5% to $211,388. These gains reflect ongoing demand pressure…

1936 Views, 0 Comments

Here is our weekly update on the Edmonton real estate market for the past 7 days: (Previous week's numbers are in brackets). 

New Listings: 157 (229, 345, 358)
Sales: 116 (244, 256, 313)
Ratio: 74% (107%, 74%, 87%)
Price Changes: 58 (211, 219, 284)
Expired/Off-Market Listings: 504 (227, 425, 206)
Net loss/gain in listings this week: -463 (-242, -336, -161)
Active single-family home listings: 1901 (2288, 2464, 2664)
Active condo listings: 1289 (1516, 1601, 1684)
Homes 4-week running average: $523 ($513, $528, $524)
Condos 4-week running average: $233 ($239, $239, $237)

388 Views, 0 Comments

Here is our weekly update on the Edmonton real estate market for the past 7 days: (Previous week's numbers are in brackets). 

New Listings: 229 (345, 358, 426)
Sales: 244 (256, 313, 295)
Ratio: 107% (74%, 87%, 69%)
Price Changes: 211 (219, 284, 274)
Expired/Off-Market Listings: 227 (425, 206, 276)
Net loss/gain in listings this week: -242 (-336, -161, -145)
Active single-family home listings: 2288 (2464, 2664, 2707)
Active condo listings: 1516 (1601, 1684, 1710)
Homes 4-week running average: $513 ($528, $524, $530)
Condos 4-week running average: $239 ($239, $237, $239)

463 Views, 0 Comments

Here is our weekly update on the Edmonton real estate market for the past 7 days: (Previous week's numbers are in brackets). 

New Listings: 345 (358, 426, 382)
Sales: 256 (313, 295, 331)
Ratio: 74% (87%, 69%, 87%)
Price Changes: 219 (284, 274, 296)
Expired/Off-Market Listings: 425 (206, 276, 248)
Net loss/gain in listings this week: -336 (-161, -145, -197)
Active single-family home listings: 2464 (2664, 2707, 2752)
Active condo listings: 1601 (1684, 1710, 1742)
Homes 4-week running average: $528 ($524, $530, $535)
Condos 4-week running average: $239 ($237, $239, $236)

428 Views, 0 Comments

The Greater Edmonton real estate market continued to follow its normal seasonal trend in November, with sales easing as expected. Even so, activity remained solid by historical standards. Sales declined 16% compared to last November, reflecting both typical seasonal cooling and the gradual moderation we have been tracking this fall.

Price growth, however, remains intact. The benchmark price for single-family homes rose 7.5% year-over-year to $508,000. Apartment-style condominiums increased 1% to $196,700, while townhouses saw a 1% gain to $272,400. With 3.6 months of supply, the region is still technically in seller’s market territory, though conditions are the closest to balanced that we’ve seen in more than two and a half years.

The underlying…

500 Views, 0 Comments

Here is our weekly update on the Edmonton real estate market for the past 7 days: (Previous week's numbers are in brackets). 

New Listings: 358 (426, 382, 563)
Sales: 313 (295, 331, 319)
Ratio: 87% (69%, 87%, 57%)
Price Changes: 284 (274, 296, 364)
Expired/Off-Market Listings: 206 (276, 248, 473)
Net loss/gain in listings this week: -161 (-145, -197, -229)
Active single-family home listings: 2664 (2707, 2752, 2855)
Active condo listings: 1684 (1710, 1742, 1789)
Homes 4-week running average: $524 ($530, $535, $527)
Condos 4-week running average: $237 ($239, $236, $235)


393 Views, 0 Comments