Here is our weekly update on the Edmonton real estate market. (Previous week's numbers are in brackets). For the past 7 days:

New Listings: 648 (581, 539, 659)
Sales: 527 (511, 495, 536)
Ratio: 81% (88%, 92%, 81%)
Price Changes: 283 (271, 224, 227)
Expired/Off-Market Listings: 210 (164, 142, 129)
Net loss/gain in listings this week: -89 (-94, -98, -6)
Active single-family home listings: 2180 (2169, 2148, 2139)
Active condo listings: 1495 (1460, 1441, 1444)
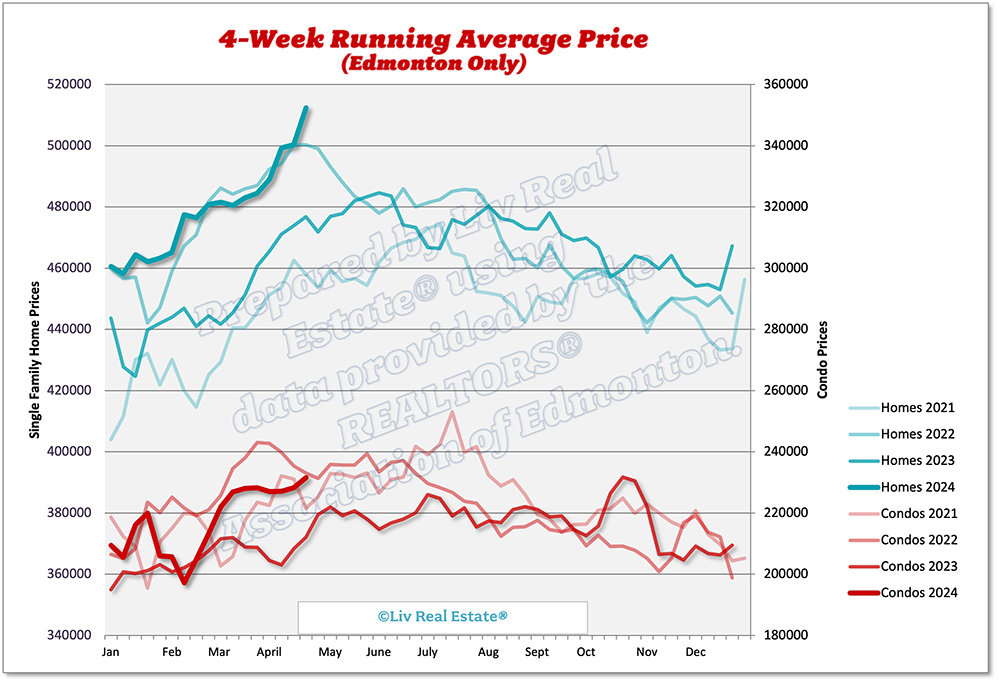
Homes 4-week running average: $524 ($527, $518, $522)
Condos 4-week running average: $239 ($236, $231, $230)

781 Views, 0 Comments


The Greater Edmonton real estate market has showed remarkable resilience and growth in May 2024. Sales increased by 18% compared to last year, with a total of 3,220 properties changing hands. This growth has outpaced the addition of new listings, which rose by 10%, leaving the inventory at a decreased level of 5,836 listings - a 17% reduction from the previous year. This has solidified Edmonton's status as a seller's market, with only 1.81 months of supply.

The Bank of Canada decreased interest rates by 0.25% yesterday, yet fixed mortgage rates are expected to remain stable for the near term.

Vigorous demand for housing has been caused by the level of interprovincial and international migration to Alberta. Last year, Alberta experienced…

1434 Views, 0 Comments

Here is our weekly update on the Edmonton real estate market. (Previous week's numbers are in brackets). For the past 7 days:

New Listings: 581 (539, 659, 660)
Sales: 511 (495, 536, 506)
Ratio: 88% (92%, 81%, 77%)
Price Changes: 271 (224, 227, 306)
Expired/Off-Market Listings: 164 (142, 129, 122)
Net loss/gain in listings this week: -94 (-98, -6, 32)
Active single-family home listings: 2169 (2148, 2139, 2036)
Active condo listings: 1460 (1441, 1444, 1424)
Homes 4-week running average: $527 ($518, $522, $518)
Condos 4-week running average: $236 ($231, $230, $234)

867 Views, 0 Comments

Here is our weekly update on the Edmonton real estate market. (Previous week's numbers are in brackets). For the past 7 days:

New Listings: 539 (659, 660, 602)
Sales: 495 (536, 506, 534)
Ratio: 92% (81%, 77%, 89%)
Price Changes: 224 (227, 306, 246)
Expired/Off-Market Listings: 142 (129, 122, 204)
Net loss/gain in listings this week: -98 (-6, 32, -136)
Active single-family home listings: 2148 (2139, 2036, 1980)
Active condo listings: 1441 (1444, 1424, 1348)
Homes 4-week running average: $518 ($522, $518, $516)
Condos 4-week running average: $231 ($230, $234, $233)

725 Views, 0 Comments

Here is our weekly update on the Edmonton real estate market. (Previous week's numbers are in brackets). For the past 7 days:

New Listings: 659 (660, 602, 596)
Sales: 536 (506, 534, 539)
Ratio: 81% (77%, 89%, 90%)
Price Changes: 227 (306, 246, 248)
Expired/Off-Market Listings: 129 (122, 204, 119)
Net loss/gain in listings this week: -6 (32, -136, -62)
Active single-family home listings: 2139 (2036, 1980, 1968)
Active condo listings: 1444 (1424, 1348, 1333)
Homes 4-week running average: $522 ($518, $516, $512)
Condos 4-week running average: $230 ($234, $233, $232)

597 Views, 0 Comments

Here is our weekly update on the Edmonton real estate market. (Previous week's numbers are in brackets). For the past 7 days:

New Listings: 660 (602, 596, 610)
Sales: 506 (534, 539, 557)
Ratio: 77% (89%, 90%, 91%)
Price Changes: 306 (246, 248, 254)
Expired/Off-Market Listings: 122 (204, 119, 117)
Net loss/gain in listings this week: 32 (-136, -62, -64)
Active single-family home listings: 2036 (1980, 1968, 1990)
Active condo listings: 1424 (1348, 1333, 1282)
Homes 4-week running average: $518 ($516, $512, $500)
Condos 4-week running average: $234 ($233, $232, $228)

653 Views, 0 Comments

In April 2024, the Greater Edmonton real estate market was characterized by high demand and record-setting prices. April witnessed a remarkable 54% increase in sales from the previous year, with a total of 3,128 transactions. This surge not only reflects robust demand but also highlights the increased interest in the Greater Edmonton area as a place to live and invest. A critical factor in this seller's market is the stark 1.75 months of supply, substantially below average and the lowest we've seen in April since I've been keeping track in 2008 (the only other times we've fallen below 2 months of supply was in February and March of 2022).

Inventory Dynamics and Market Pressures

With new listings up by 12% over the last year, relief in the tight…

1110 Views, 0 Comments

Here is our weekly update on the Edmonton real estate market. (Previous week's numbers are in brackets). For the past 7 days:

New Listings: 602 (596, 610, 556)
Sales: 534 (539, 557, 488)
Ratio: 89% (90%, 91%, 88%)
Price Changes: 246 (248, 254, 211)
Expired/Off-Market Listings: 204 (119, 117, 100)
Net loss/gain in listings this week: -136 (-62, -64, -32)
Active single-family home listings: 1980 (1968, 1990, 1997)
Active condo listings: 1348 (1333, 1282, 1241)
Homes 4-week running average: $516 ($512, $500, $499)
Condos 4-week running average: $233 ($232, $228, $227)

648 Views, 0 Comments

Here is our weekly update on the Edmonton real estate market. (Previous week's numbers are in brackets). For the past 7 days:

New Listings: 596 (610, 556, 568)
Sales: 539 (557, 488, 419)
Ratio: 90% (91%, 88%, 74%)
Price Changes: 248 (254, 211, 184)
Expired/Off-Market Listings: 119 (117, 100, 141)
Net loss/gain in listings this week: -62 (-64, -32, 8)
Active single-family home listings: 1968 (1990, 1997, 1959)
Active condo listings: 1333 (1282, 1241, 1208)
Homes 4-week running average: $512 ($500, $499, $489)
Condos 4-week running average: $232 ($228, $227, $227)

629 Views, 0 Comments

Here is our weekly update on the Edmonton real estate market. (Previous week's numbers are in brackets). For the past 7 days:

New Listings: 610 (556, 568, 541)
Sales: 557 (488, 419, 488)
Ratio: 91% (88%, 74%, 90%)
Price Changes: 254 (211, 184, 171)
Expired/Off-Market Listings: 117 (100, 141, 90)
Net loss/gain in listings this week: -64 (-32, 8, -37)
Active single-family home listings: 1990 (1997, 1959, 1925)
Active condo listings: 1282 (1241, 1208, 1175)
Homes 4-week running average: $500 ($499, $489, $484)
Condos 4-week running average: $228 ($227, $227, $228)

568 Views, 0 Comments