Greater Edmonton's housing market continues to favour sellers, though the advantage is beginning to soften as supply increases.

Year-over-year, prices continue to rise: the benchmark price for single-family homes increased by 9% to $518,900; apartment-style condos saw a 2% rise to $201,900; and townhouses gained 6% to $286,500. This pattern reflects buyer demand for space and versatility, with detached homes leading in price growth, followed by townhouses, while condos are starting to lag.

The market remains tight, with only three months of supply, maintaining a seller's market that has lasted over two years. However, clear signs of change are emerging. New listings have risen by 9%, exceeding seasonal norms, and inventory has climbed by 23%,…

1020 Views, 0 Comments

Here is our weekly update on the Edmonton real estate market for the past 7 days: (Previous week's numbers are in brackets). 

New Listings: 600 (644, 662, 633)
Sales: 408 (447, 401, 399)
Ratio: 68% (69%, 61%, 63%)
Price Changes: 454 (515, 433, 428)
Expired/Off-Market Listings: 239 (243, 268, 358)
Net loss/gain in listings this week: -47 (-46, -7, -124)
Active single-family home listings: 3080 (3068, 2979, 2946)
Active condo listings: 1962 (1946, 1956, 1942)
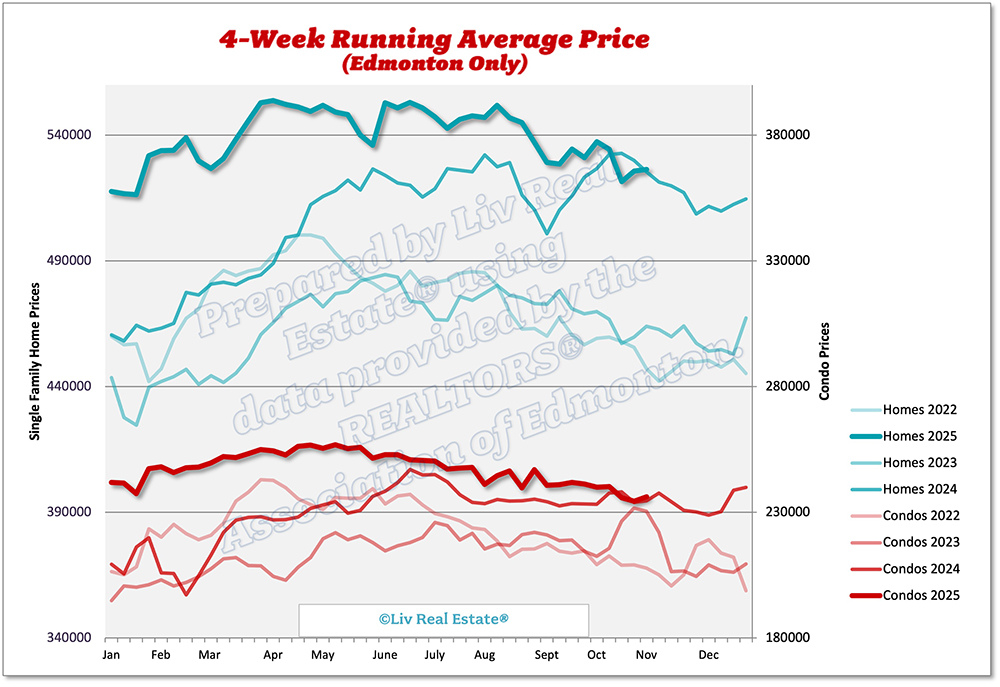
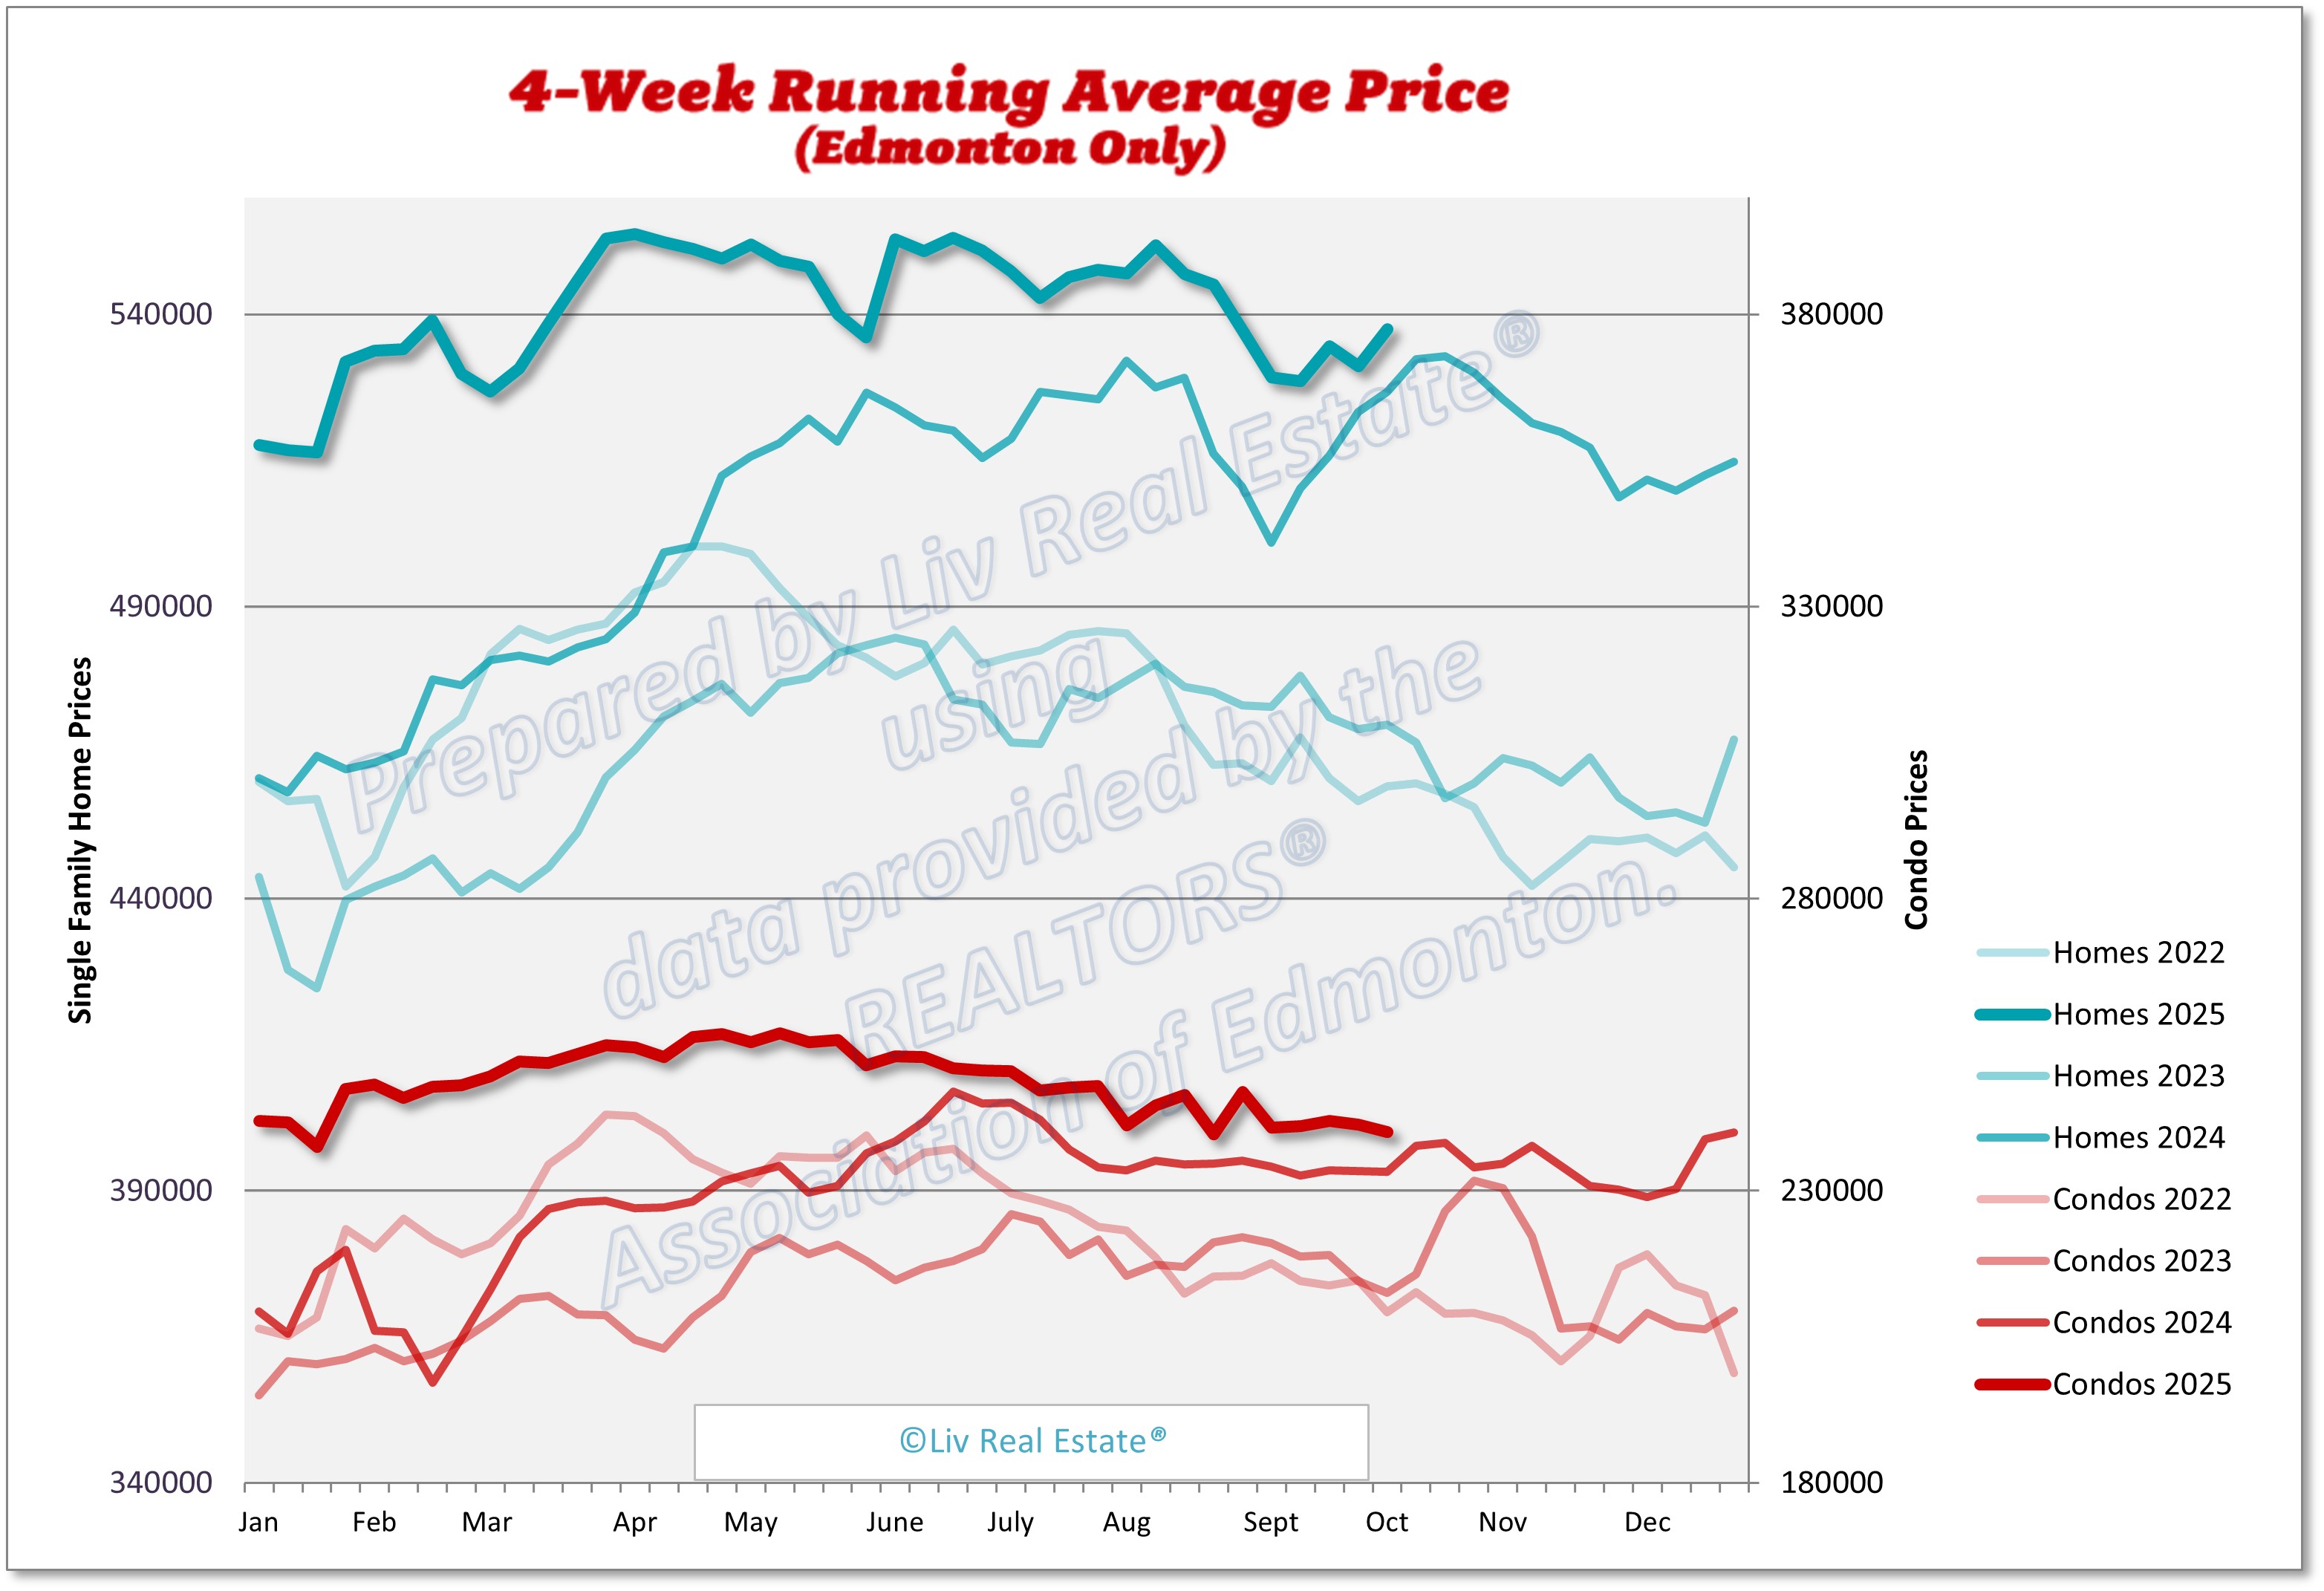
Homes 4-week running average:  $537 ($545, $547, $552)
Condos 4-week running average: $247 ($240, $246, $245)

548 Views, 0 Comments

Here is our weekly update on the Edmonton real estate market for the past 7 days: (Previous week's numbers are in brackets). 

New Listings: 644 (662, 633, 645)
Sales: 447 (401, 399, 432)
Ratio: 69% (61%, 63%, 67%)
Price Changes: 515 (433, 428, 380)
Expired/Off-Market Listings: 243 (268, 358, 334)
Net loss/gain in listings this week: -46 (-7, -124, -121)
Active single-family home listings: 3068 (2979, 2946, 2916)
Active condo listings: 1946 (1956, 1942, 1907)
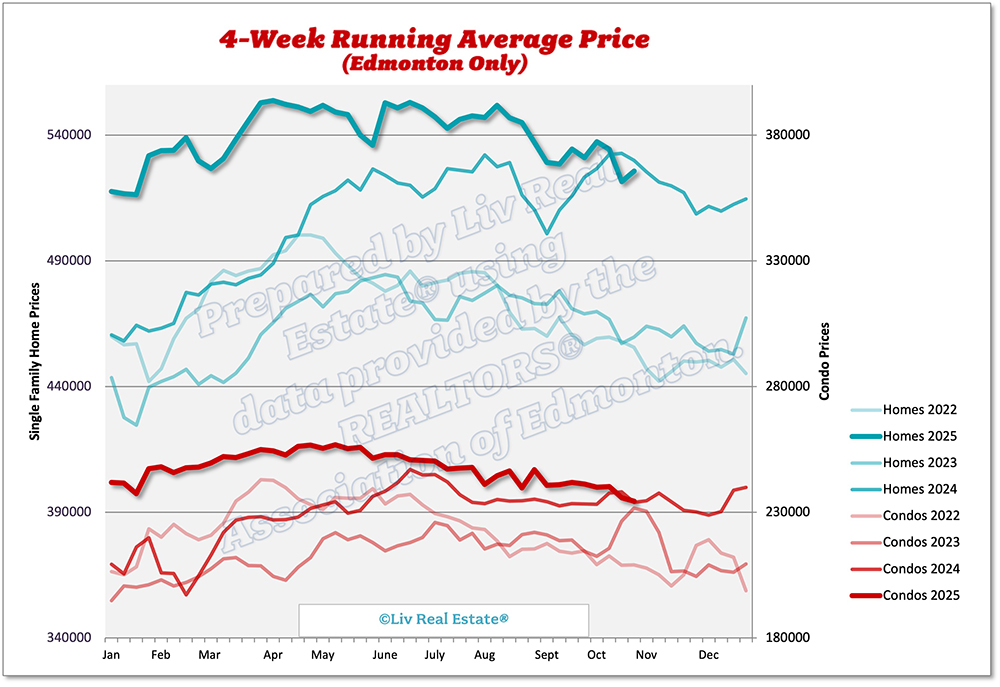
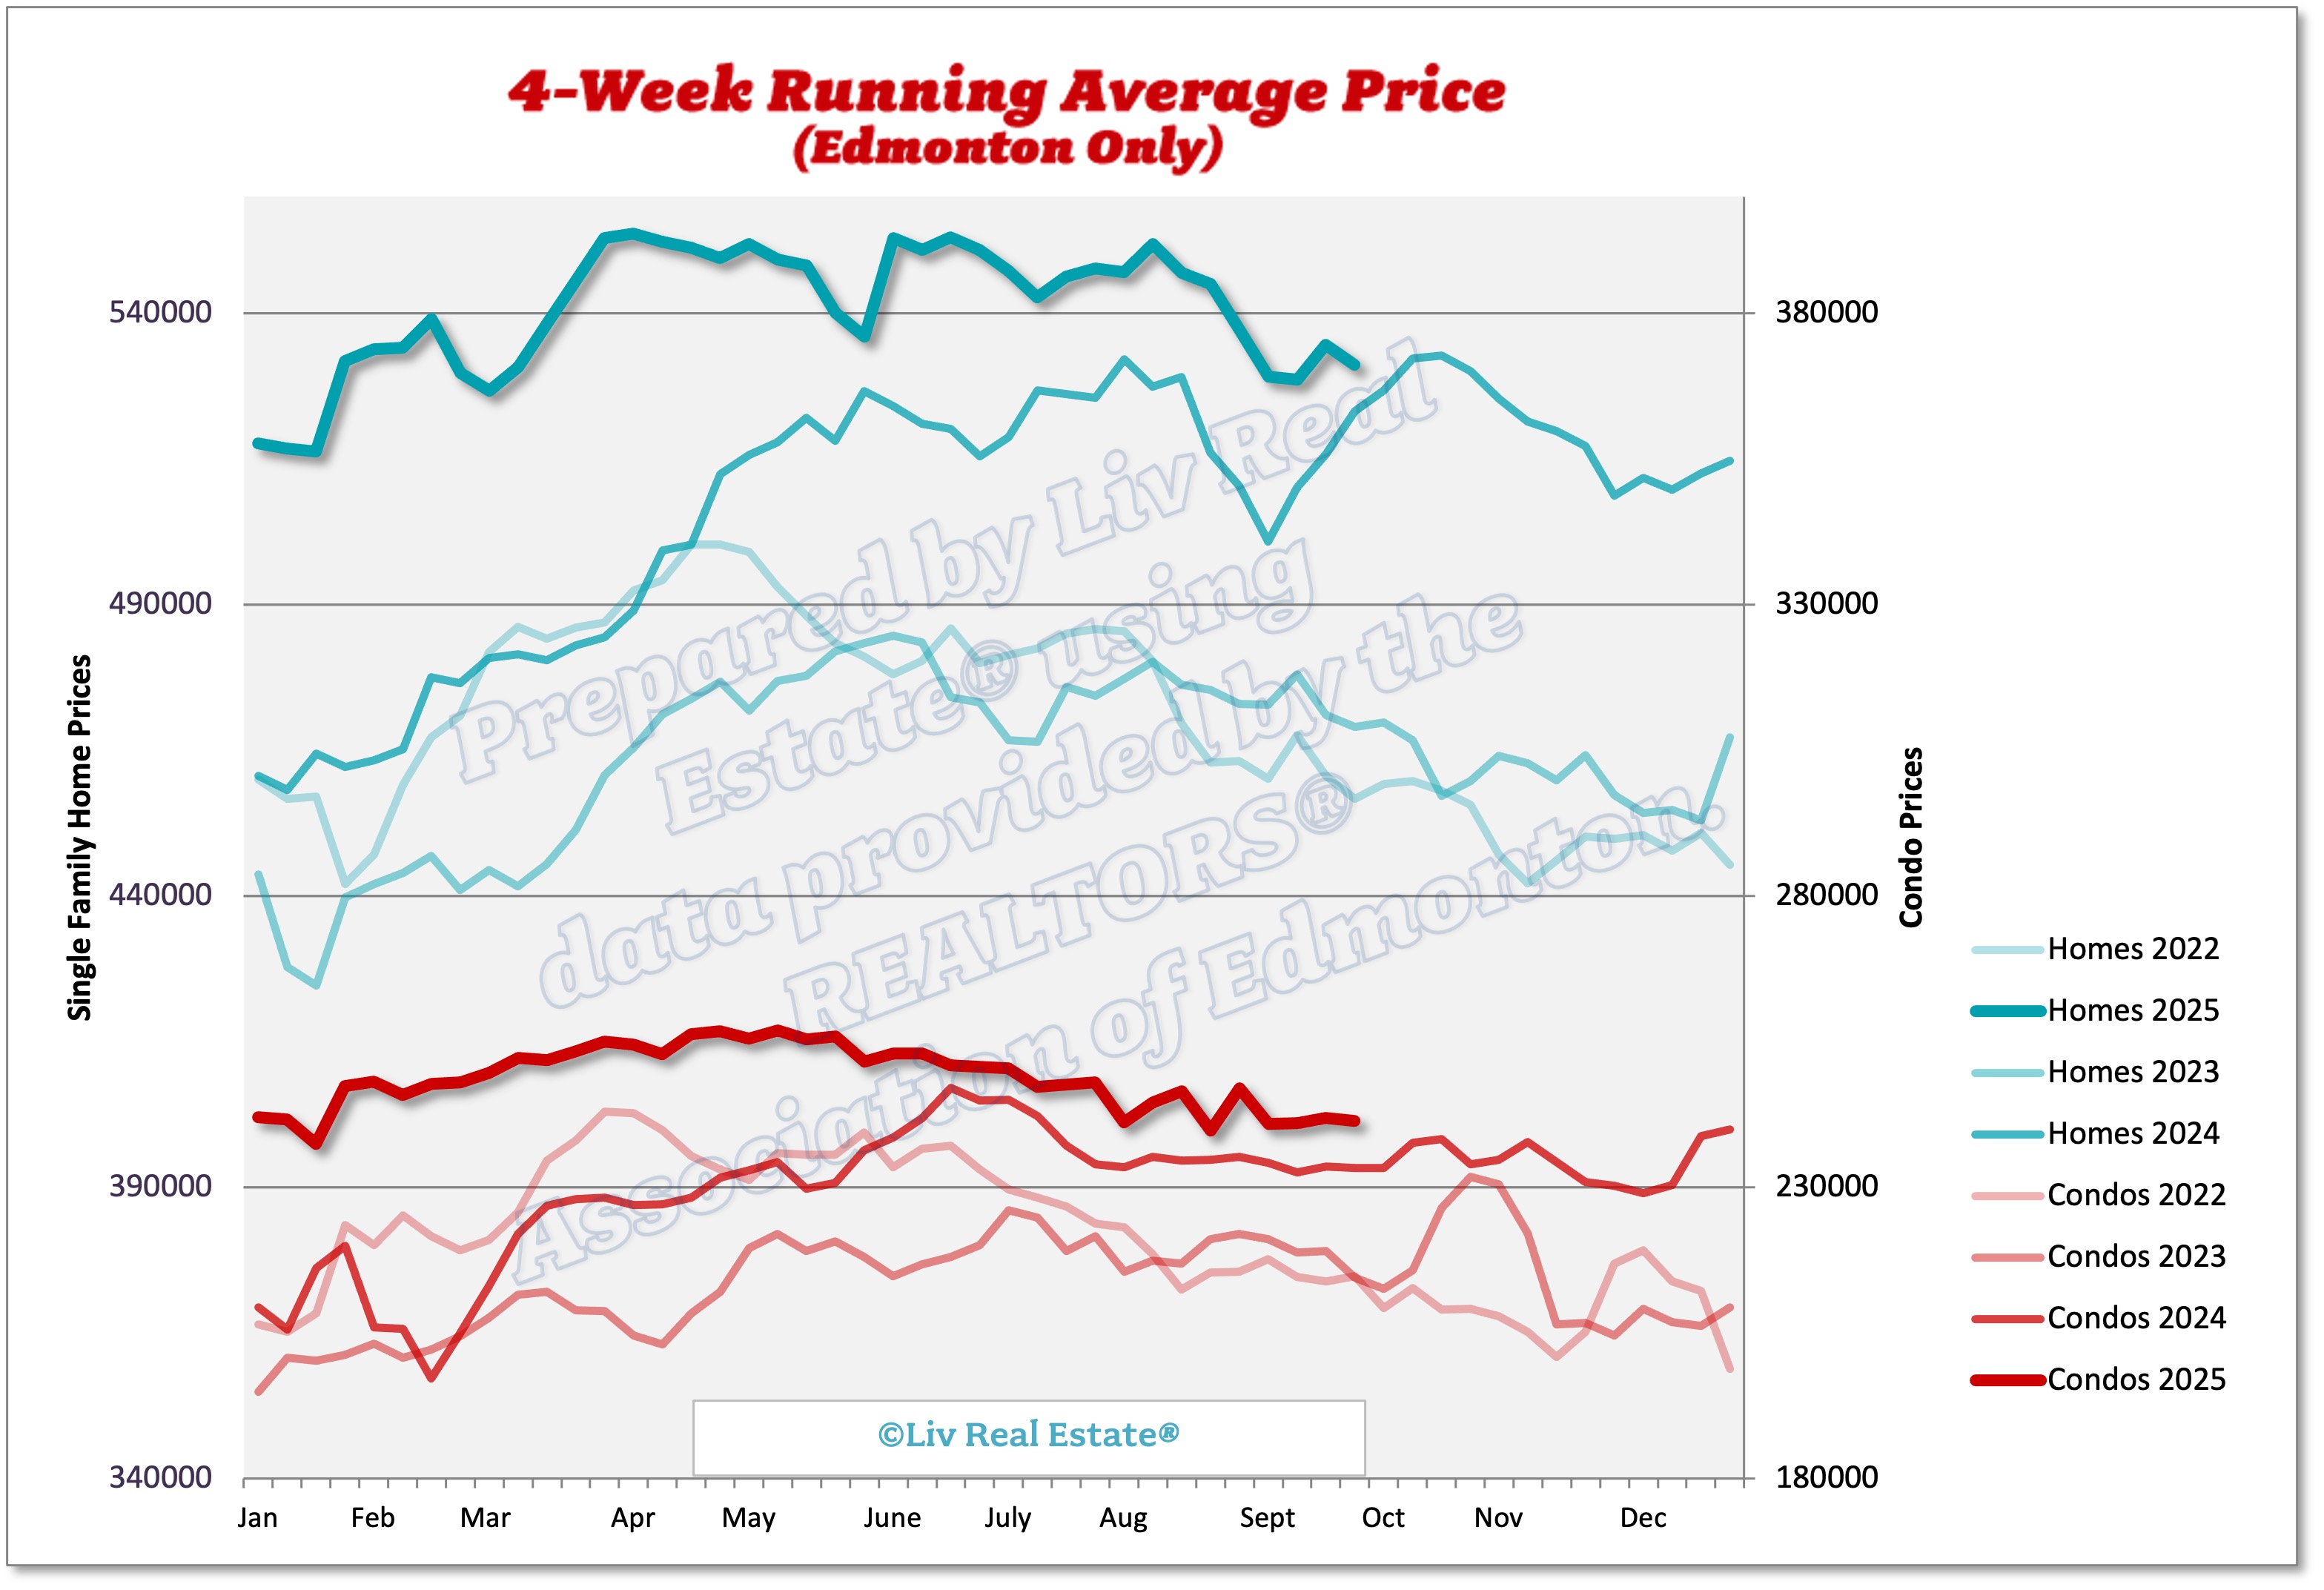
Homes 4-week running average:  $545 ($547, $552, $547)
Condos 4-week running average: $240 ($246, $245, $241)

591 Views, 0 Comments

Here is our weekly update on the Edmonton real estate market for the past 7 days: (Previous week's numbers are in brackets). 

New Listings: 662 (633, 645, 698)
Sales: 401 (399, 432, 478)
Ratio: 61% (63%, 67%, 68%)
Price Changes: 433 (428, 380, 406)
Expired/Off-Market Listings: 268 (358, 334, 263)
Net loss/gain in listings this week: -7 (-124, -121, -43)
Active single-family home listings: 2979 (2946, 2916, 2962)
Active condo listings: 1956 (1942, 1907, 1915)
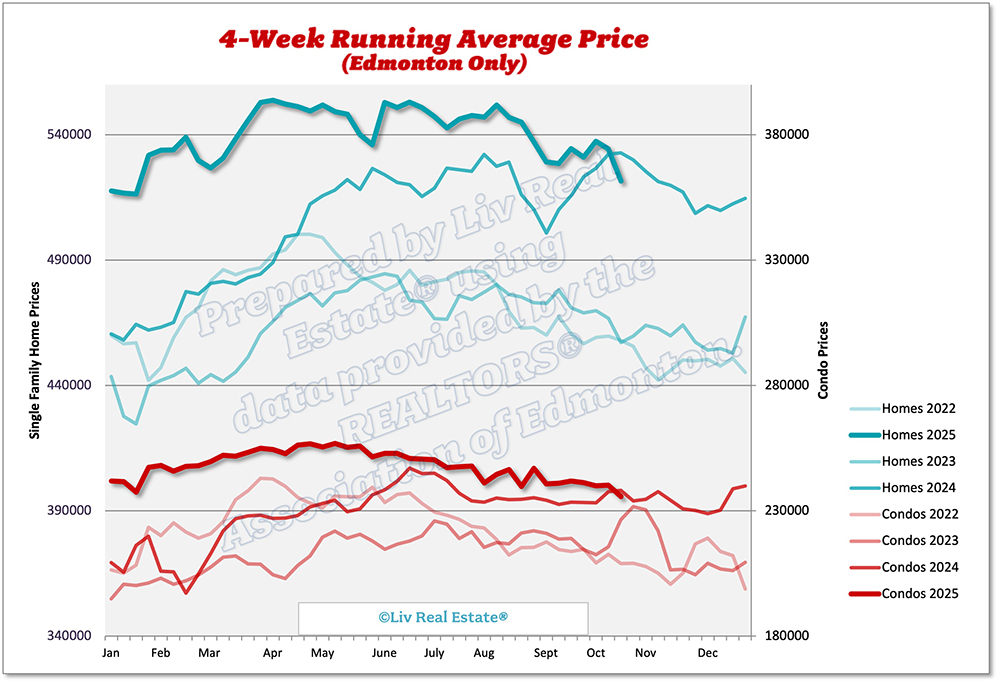
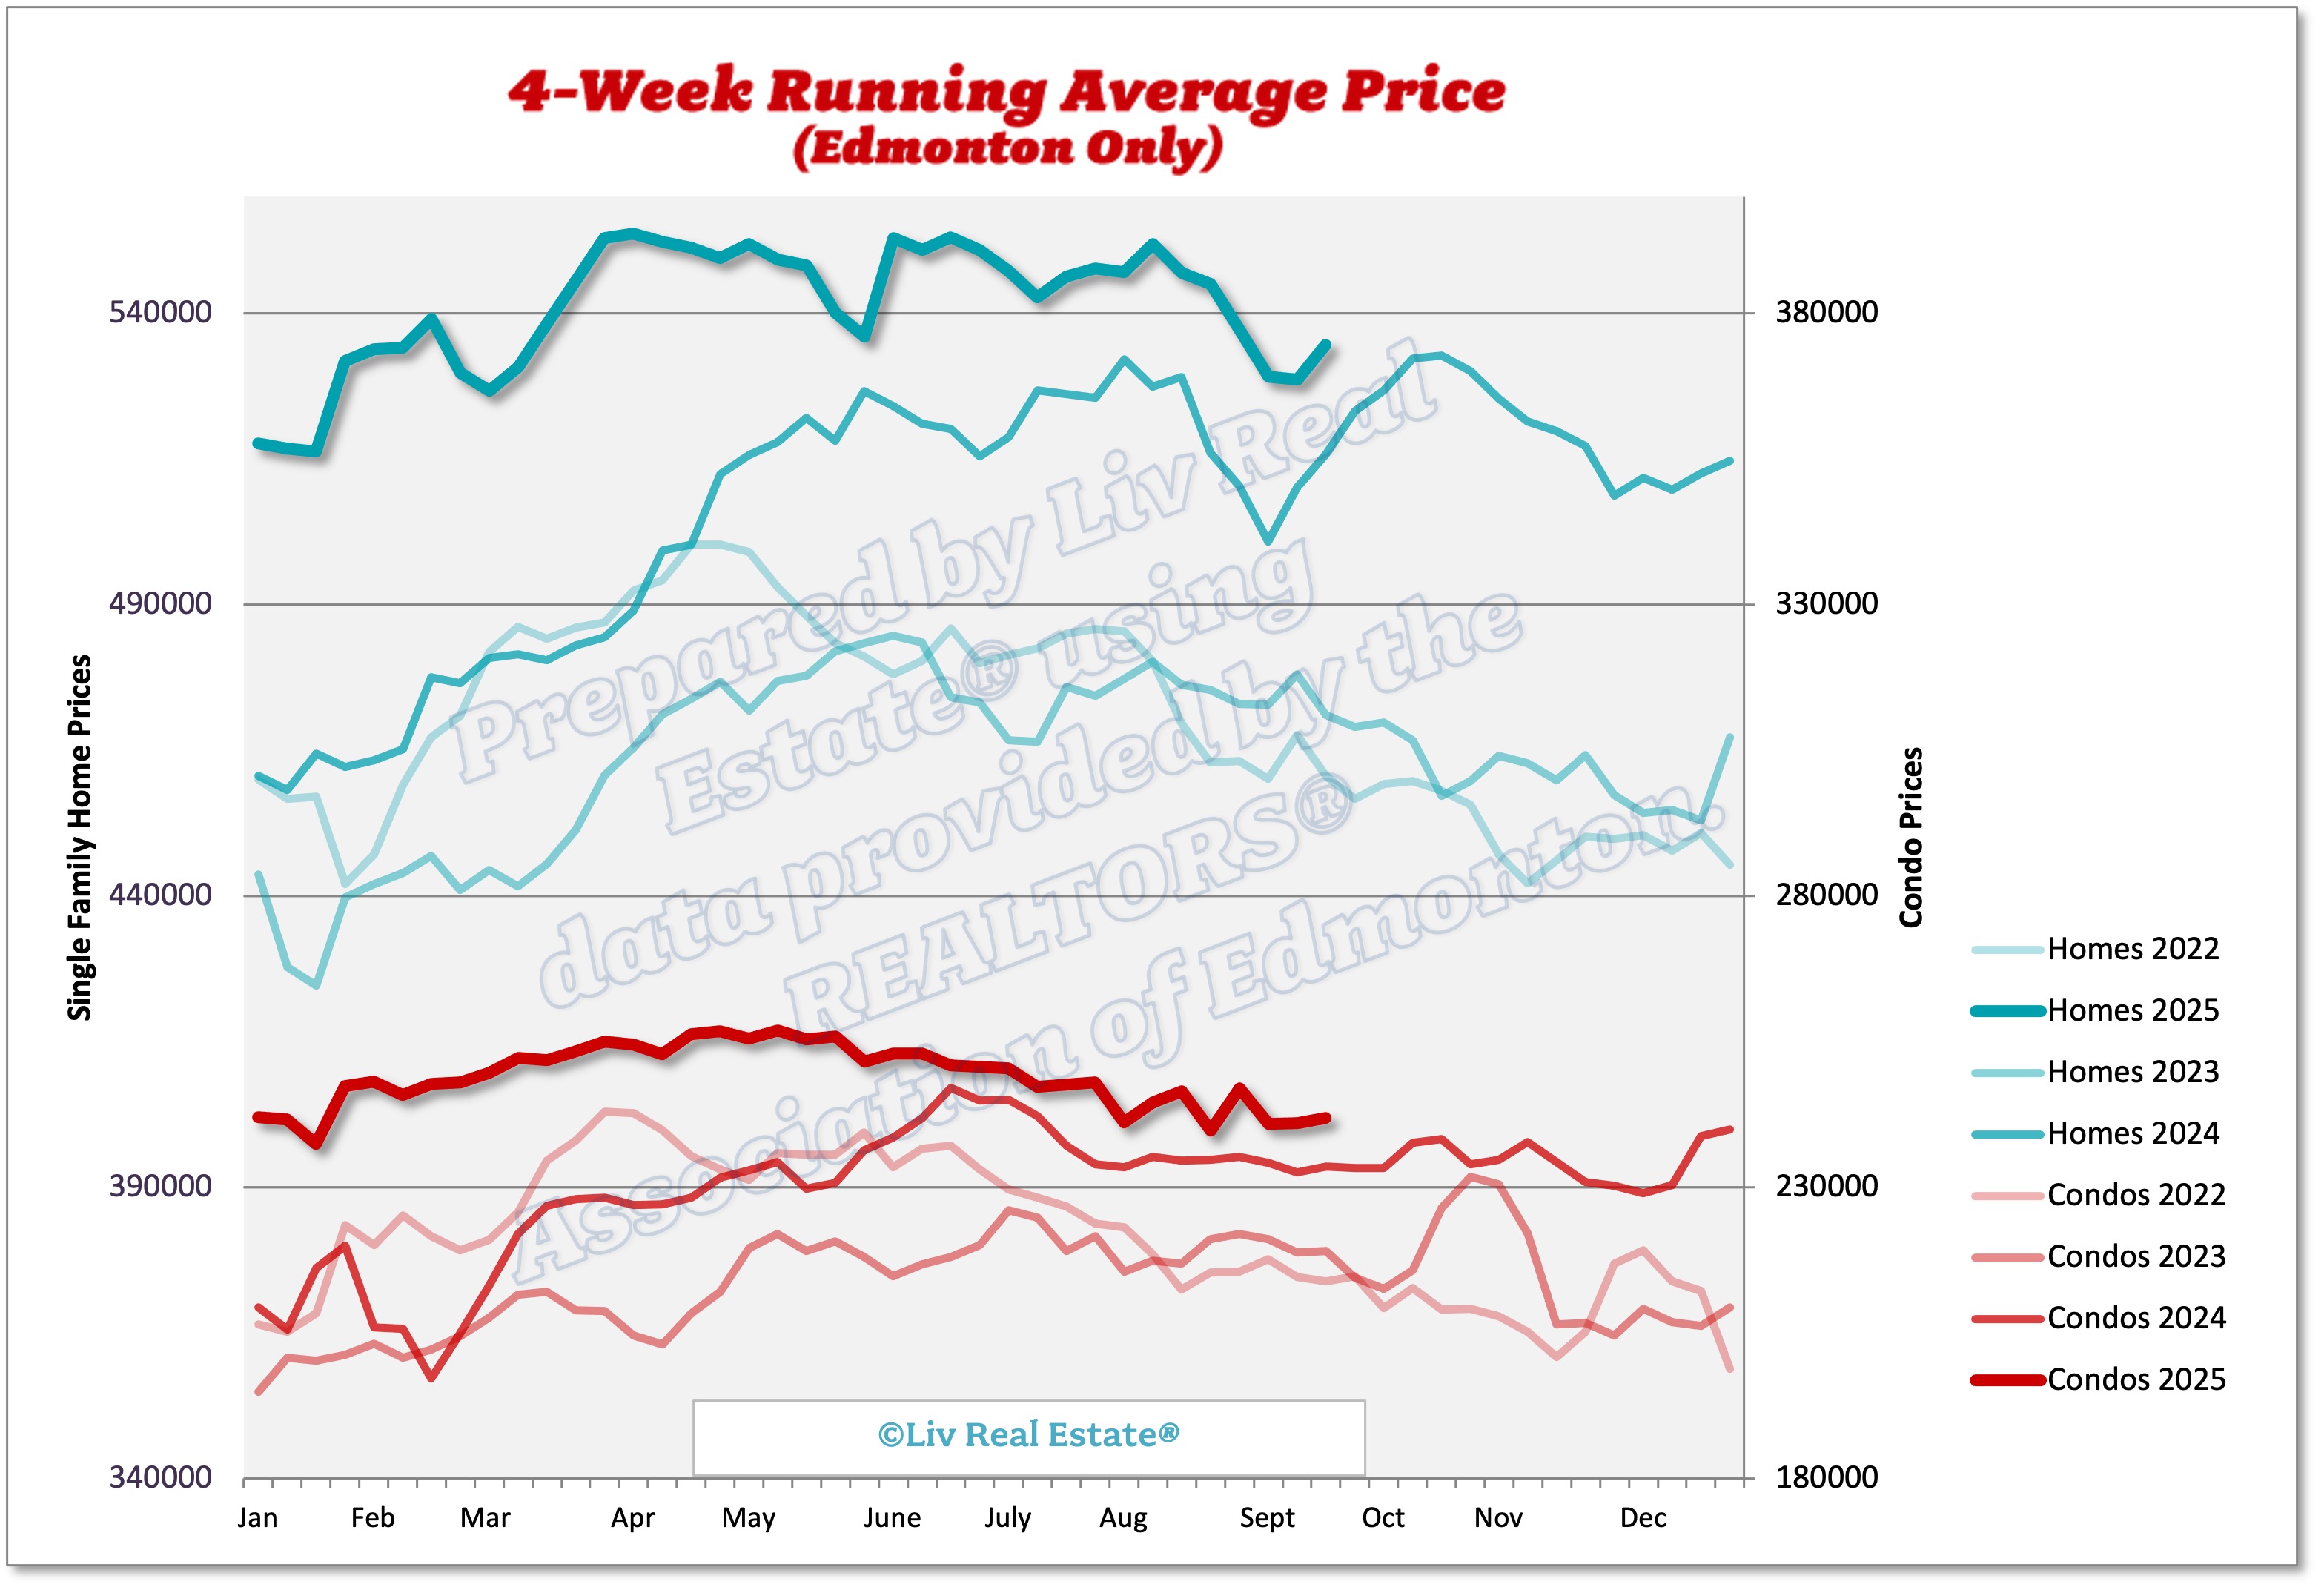
Homes 4-week running average:  $547 ($552, $547, $548)
Condos 4-week running average: $246 ($245, $241, $248)

604 Views, 0 Comments

Here is our weekly update on the Edmonton real estate market for the past 7 days: (Previous week's numbers are in brackets). 

New Listings: 633 (645, 698, 748)
Sales: 399 (432, 478, 509)
Ratio: 63% (67%, 68%, 68%)
Price Changes: 428 (380, 406, 411)
Expired/Off-Market Listings: 358 (334, 263, 264)
Net loss/gain in listings this week: -124 (-121, -43, -25)
Active single-family home listings: 2946 (2916, 2962, 2944)
Active condo listings: 1942 (1907, 1915, 1880)
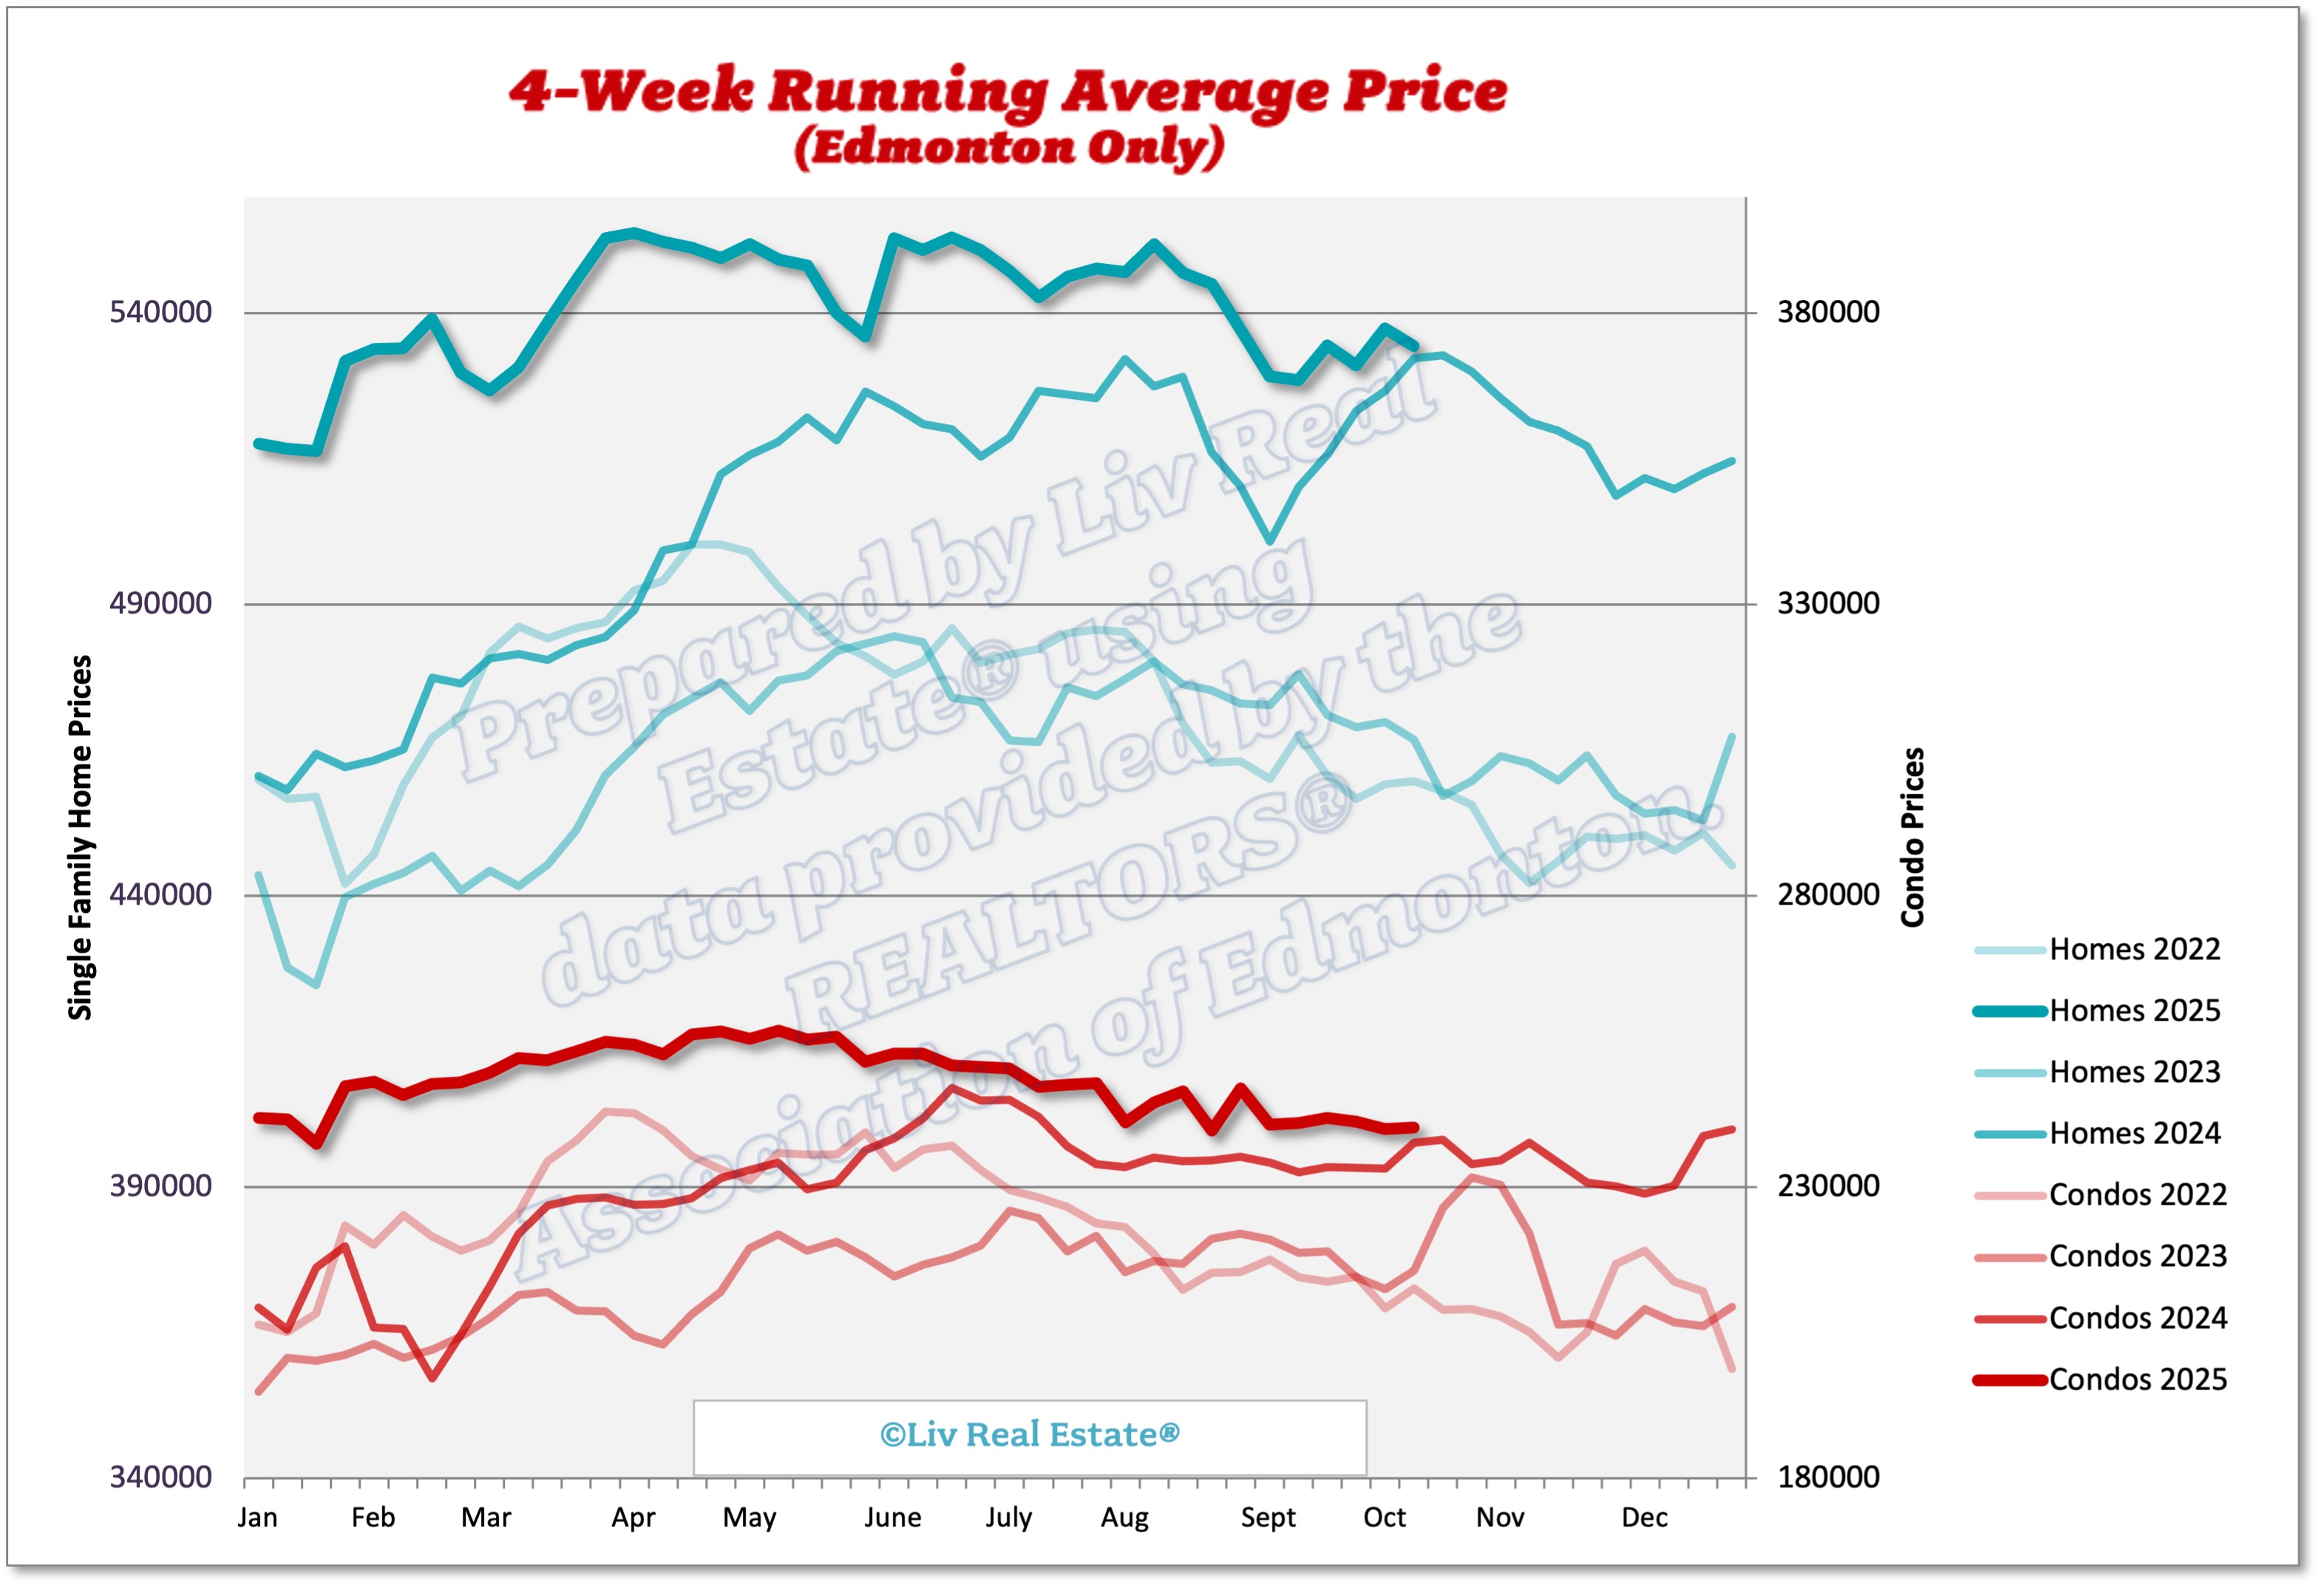
Homes 4-week running average:  $552 ($547, $548, $546)
Condos 4-week running average: $245 ($241, $248, $248)

593 Views, 0 Comments

In the Greater Edmonton Area, the real estate market in July 2025 revealed some intriguing trends. Let’s take a closer look at the key numbers that illustrate a market that's still favourable to sellers while also offering increasing opportunities for buyers.

The benchmark price for single-family homes rose to $517,900, reflecting a 9% increase from the previous year. Apartment-style condos experienced a 4% increase to $204,000, while townhouses climbed by 8% to $286,500. We find ourselves in a seller's market, characterized by just two and a half months of supply—continuing a trend that has persisted for over two years.

However, beneath these rising prices, we can observe subtle signs of shifting dynamics. New listings have surged by 17%,…

1598 Views, 0 Comments

Here is our weekly update on the Edmonton real estate market for the past 7 days: (Previous week's numbers are in brackets). 

New Listings: 645 (698, 748, 798)
Sales: 432 (478, 509, 445)
Ratio: 67% (68%, 68%, 56%)
Price Changes: 380 (406, 411, 458)
Expired/Off-Market Listings: 334 (263, 264, 256)
Net loss/gain in listings this week: -121 (-43, -25, 97)
Active single-family home listings: 2916 (2962, 2944, 2893)
Active condo listings: 1907 (1915, 1880, 1819)
Homes 4-week running average:  $547 ($548, $546, $543)
Condos 4-week running average: $241 ($248, $248, $247)

706 Views, 0 Comments

Here is our weekly update on the Edmonton real estate market for the past 7 days: (Previous week's numbers are in brackets). 

New Listings: 698 (748, 798, 722)
Sales: 478 (509, 445, 421)
Ratio: 68% (68%, 56%, 58%)
Price Changes: 406 (411, 458, 387)
Expired/Off-Market Listings: 263 (264, 256, 321)
Net loss/gain in listings this week: -43 (-25, 97, -20)
Active single-family home listings: 2962 (2944, 2893, 2798)
Active condo listings: 1915 (1880, 1819, 1761)
Homes 4-week running average:  $548 ($546, $543, $547)
Condos 4-week running average: $248 ($248, $247, $250)

764 Views, 0 Comments

Here is our weekly update on the Edmonton real estate market for the past 7 days: (Previous week's numbers are in brackets). 

New Listings: 748 (798, 722, 699)
Sales: 509 (445, 421, 452)
Ratio: 68% (56%, 58%, 65%)
Price Changes: 411 (458, 387, 398)
Expired/Off-Market Listings: 264 (256, 321, 268)
Net loss/gain in listings this week: -25 (97, -20, -21)
Active single-family home listings: 2944 (2893, 2798, 2745)
Active condo listings: 1880 (1819, 1761, 1775)
Homes 4-week running average:  $546 ($543, $547, $551)
Condos 4-week running average: $248 ($247, $250, $251)

659 Views, 0 Comments

Here is our weekly update on the Edmonton real estate market for the past 7 days: (Previous week's numbers are in brackets). 

New Listings: 798 (722, 699, 671)
Sales: 445 (421, 452, 479)
Ratio: 56% (58%, 65%, 71%)
Price Changes: 458 (387, 398, 463)
Expired/Off-Market Listings: 256 (321, 268, 207)
Net loss/gain in listings this week: 97 (-20, -21, -15)
Active single-family home listings: 2893 (2798, 2745, 2690)
Active condo listings: 1819 (1761, 1775, 1805)
Homes 4-week running average:  $543 ($547, $551, $553)
Condos 4-week running average: $247 ($250, $251, $251)


759 Views, 0 Comments