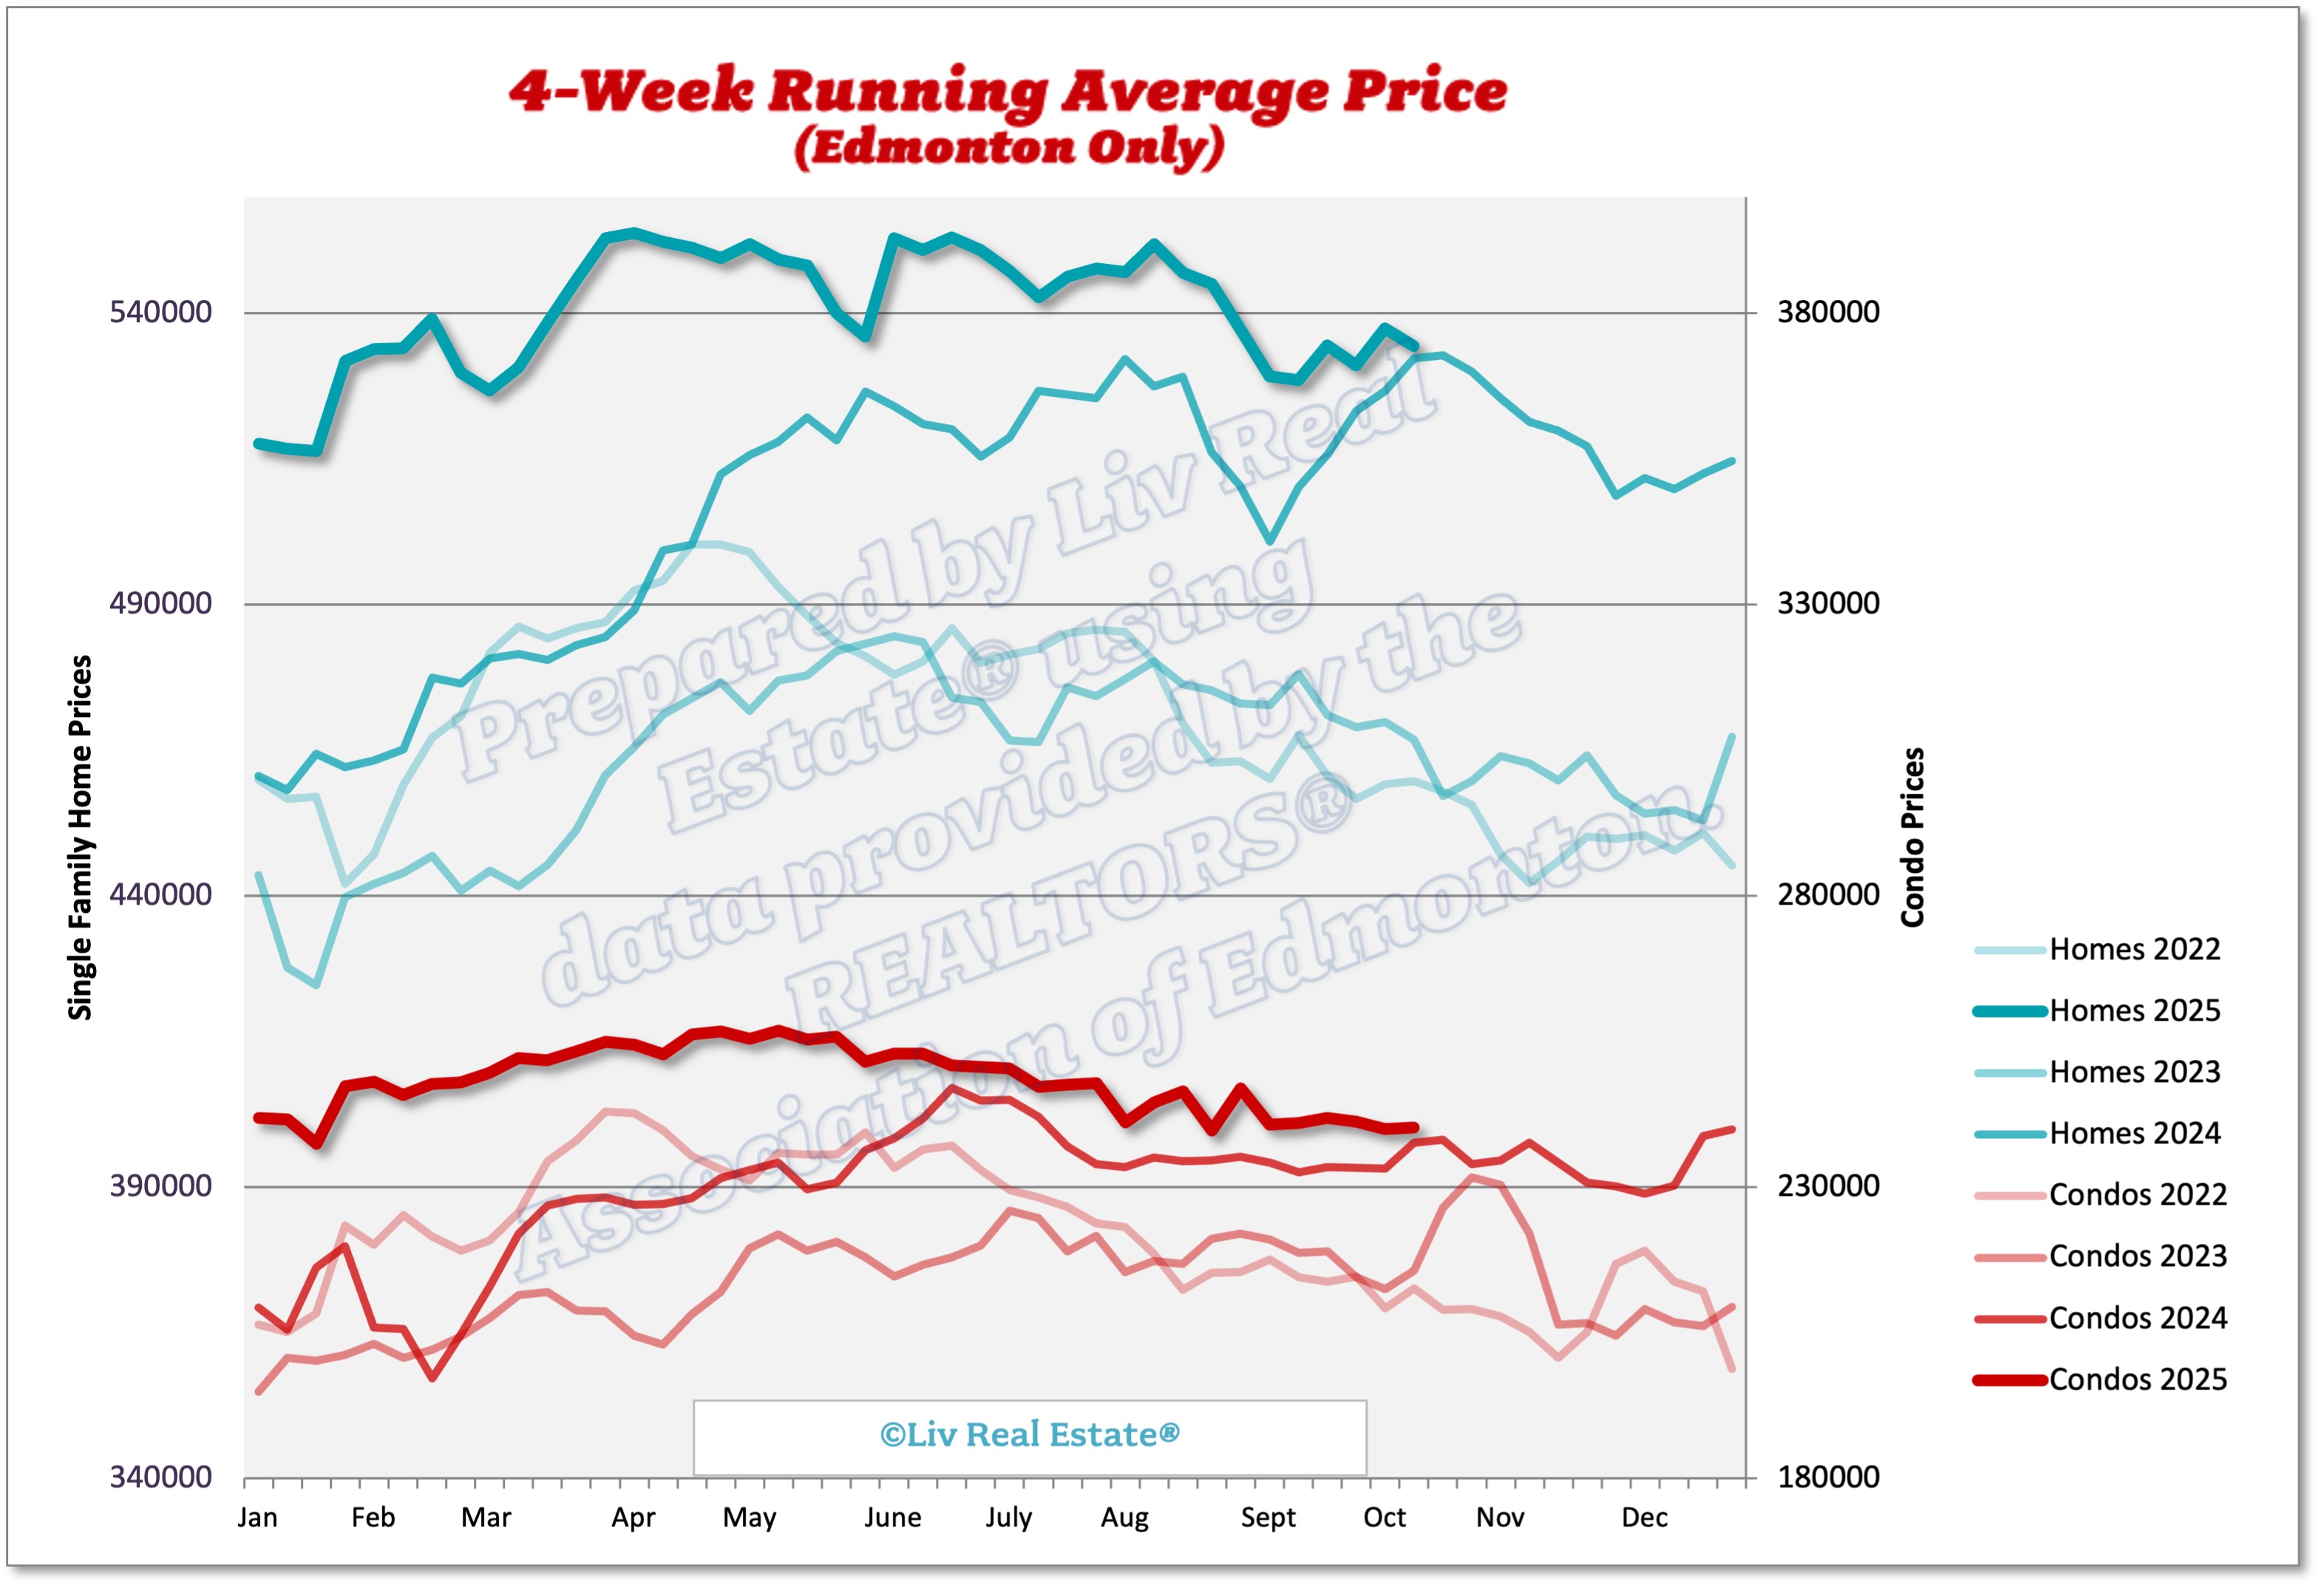
Here is our weekly update on the Edmonton real estate market for the past 7 days: (Previous week's numbers are in brackets). 

New Listings: 591 (655, 650, 478)
Sales: 452 (446, 414, 340)
Ratio: 76% (68%, 64%, 71%)
Price Changes: 235 (221, 244, 190)
Expired/Off-Market Listings: 108 (99, 206, 91)
Net loss/gain in listings this week: 31 (110, 30, 47)
Active single-family home listings: 1794 (1728, 1629, 1534)
Active condo listings: 1193 (1145, 1071, 1046)
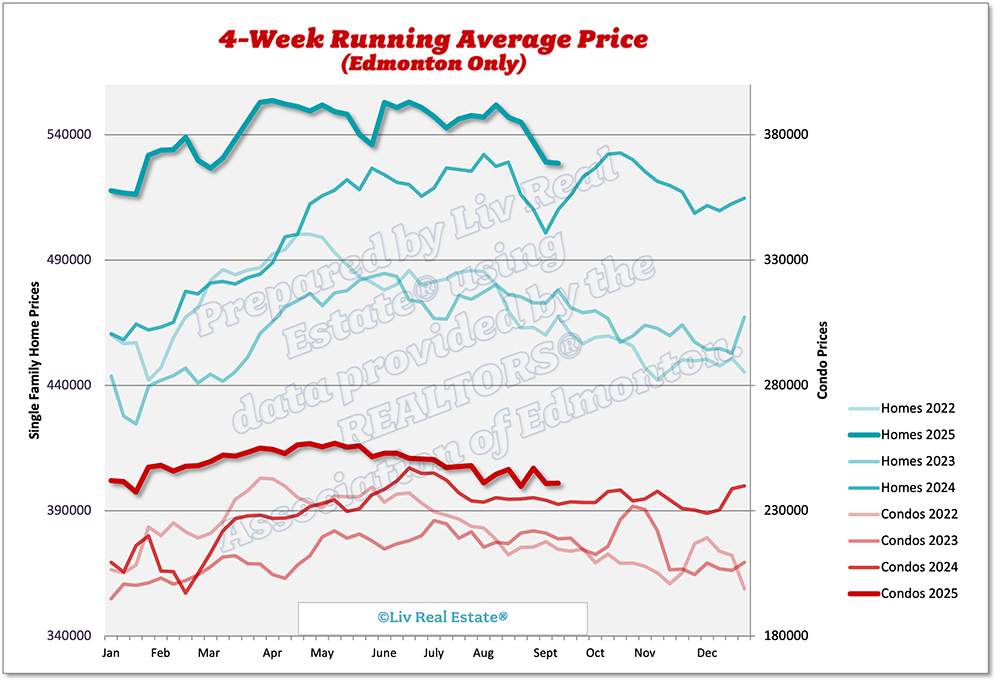
Homes 4-week running average:$546 ($538, $531, $527)
Condos 4-week running average: $253 ($252, $252, $250)

115 Views, 0 Comments

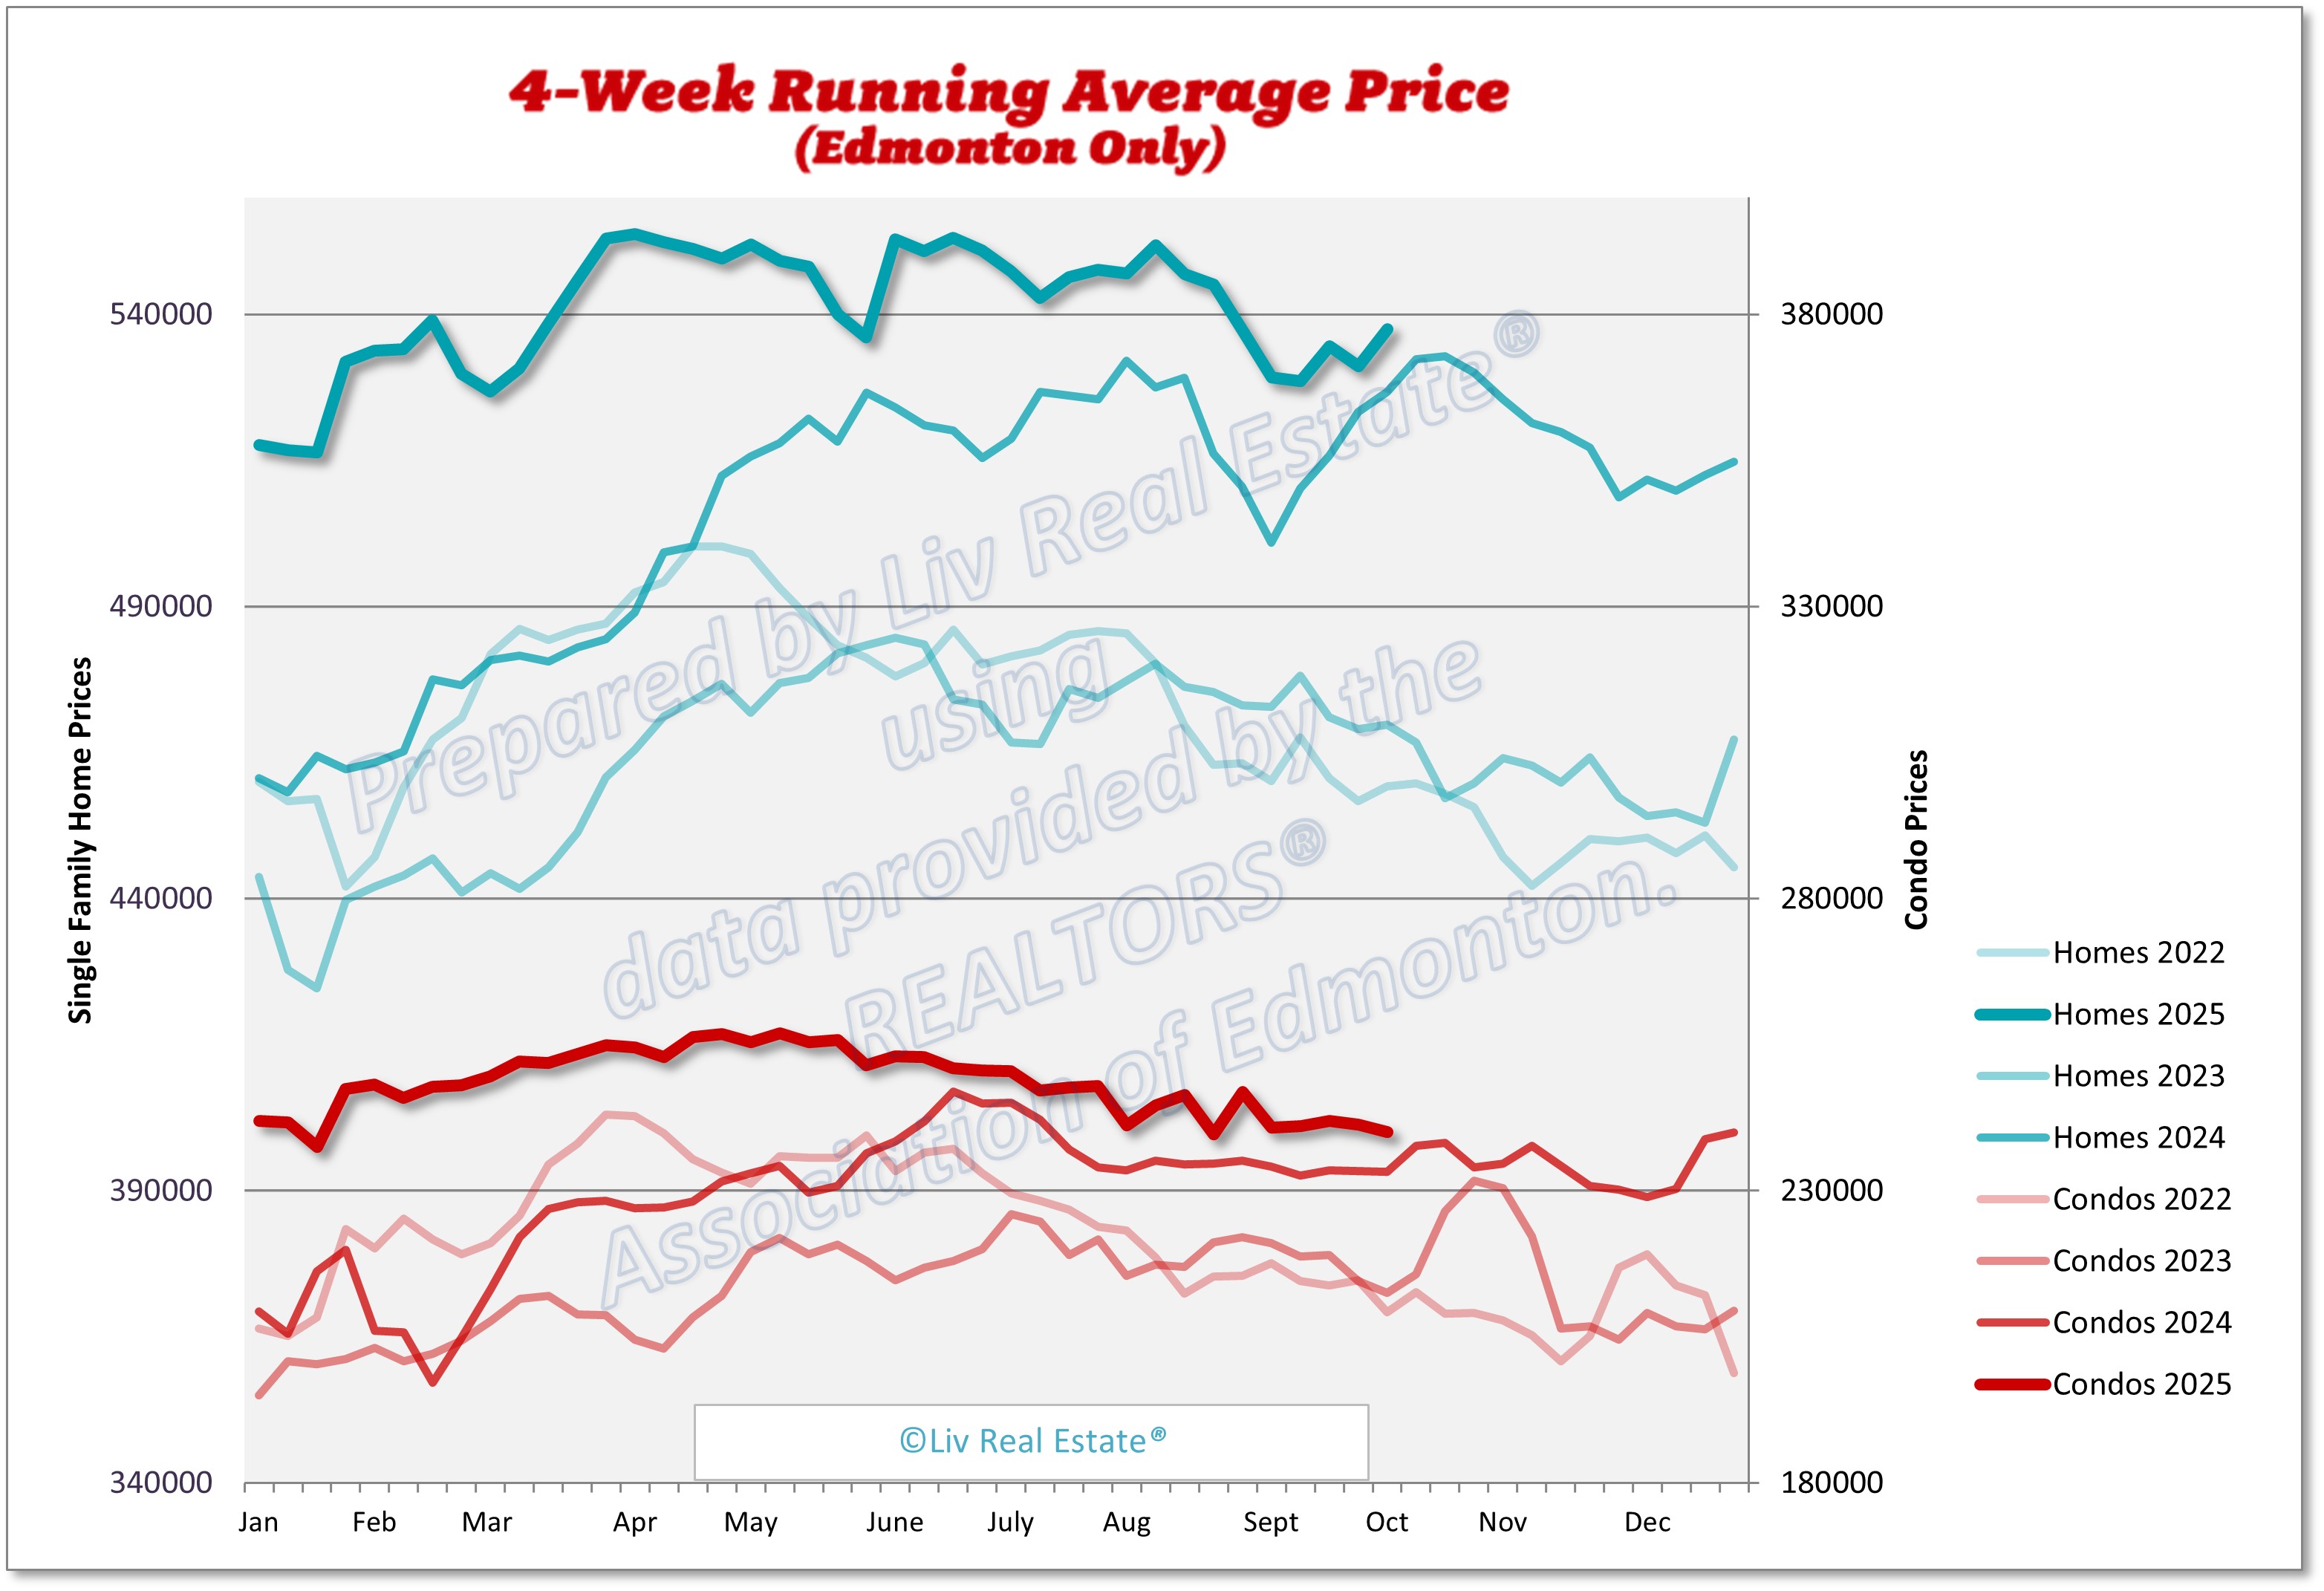
Here is our weekly update on the Edmonton real estate market for the past 7 days: (Previous week's numbers are in brackets). 

New Listings: 655 (650, 478, 431)
Sales: 446 (414, 340, 322)
Ratio: 68 (64%, 71%, 75%)
Price Changes: 221 (244, 190, 160)
Expired/Off-Market Listings: 99 (206, 91, 83)
Net loss/gain in listings this week: 110 (30, 47, 26)
Active single-family home listings: 1728 (1629, 1534, 1471)
Active condo listings: 1145 (1071, 1046, 1028)
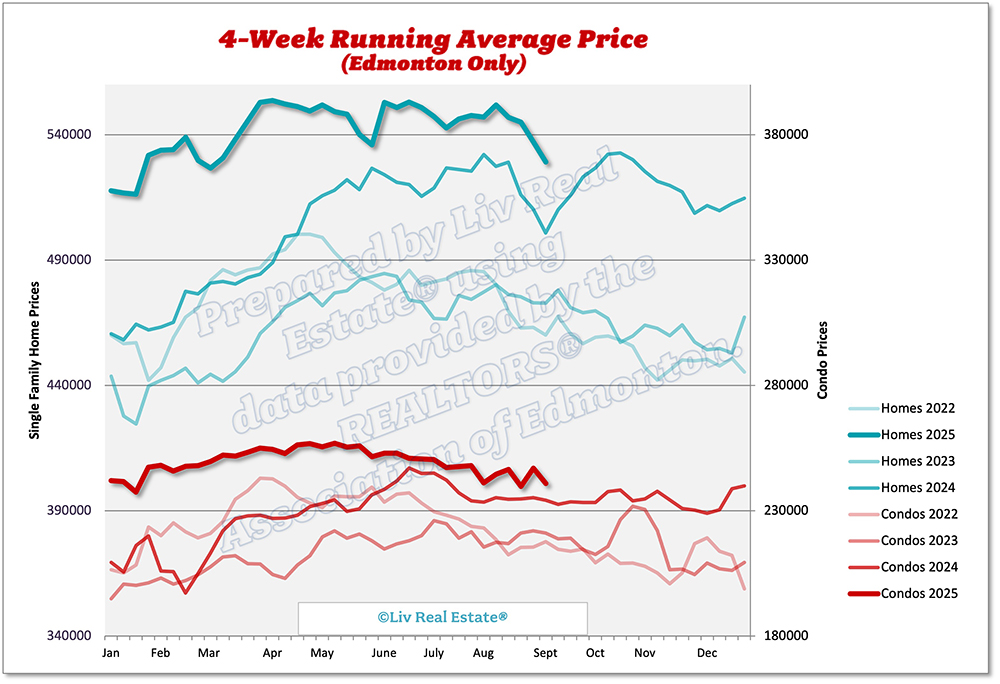
Homes 4-week running average: $538 ($531, $527, $530)
Condos 4-week running average: $252 ($252, $250, $248)


193 Views, 0 Comments

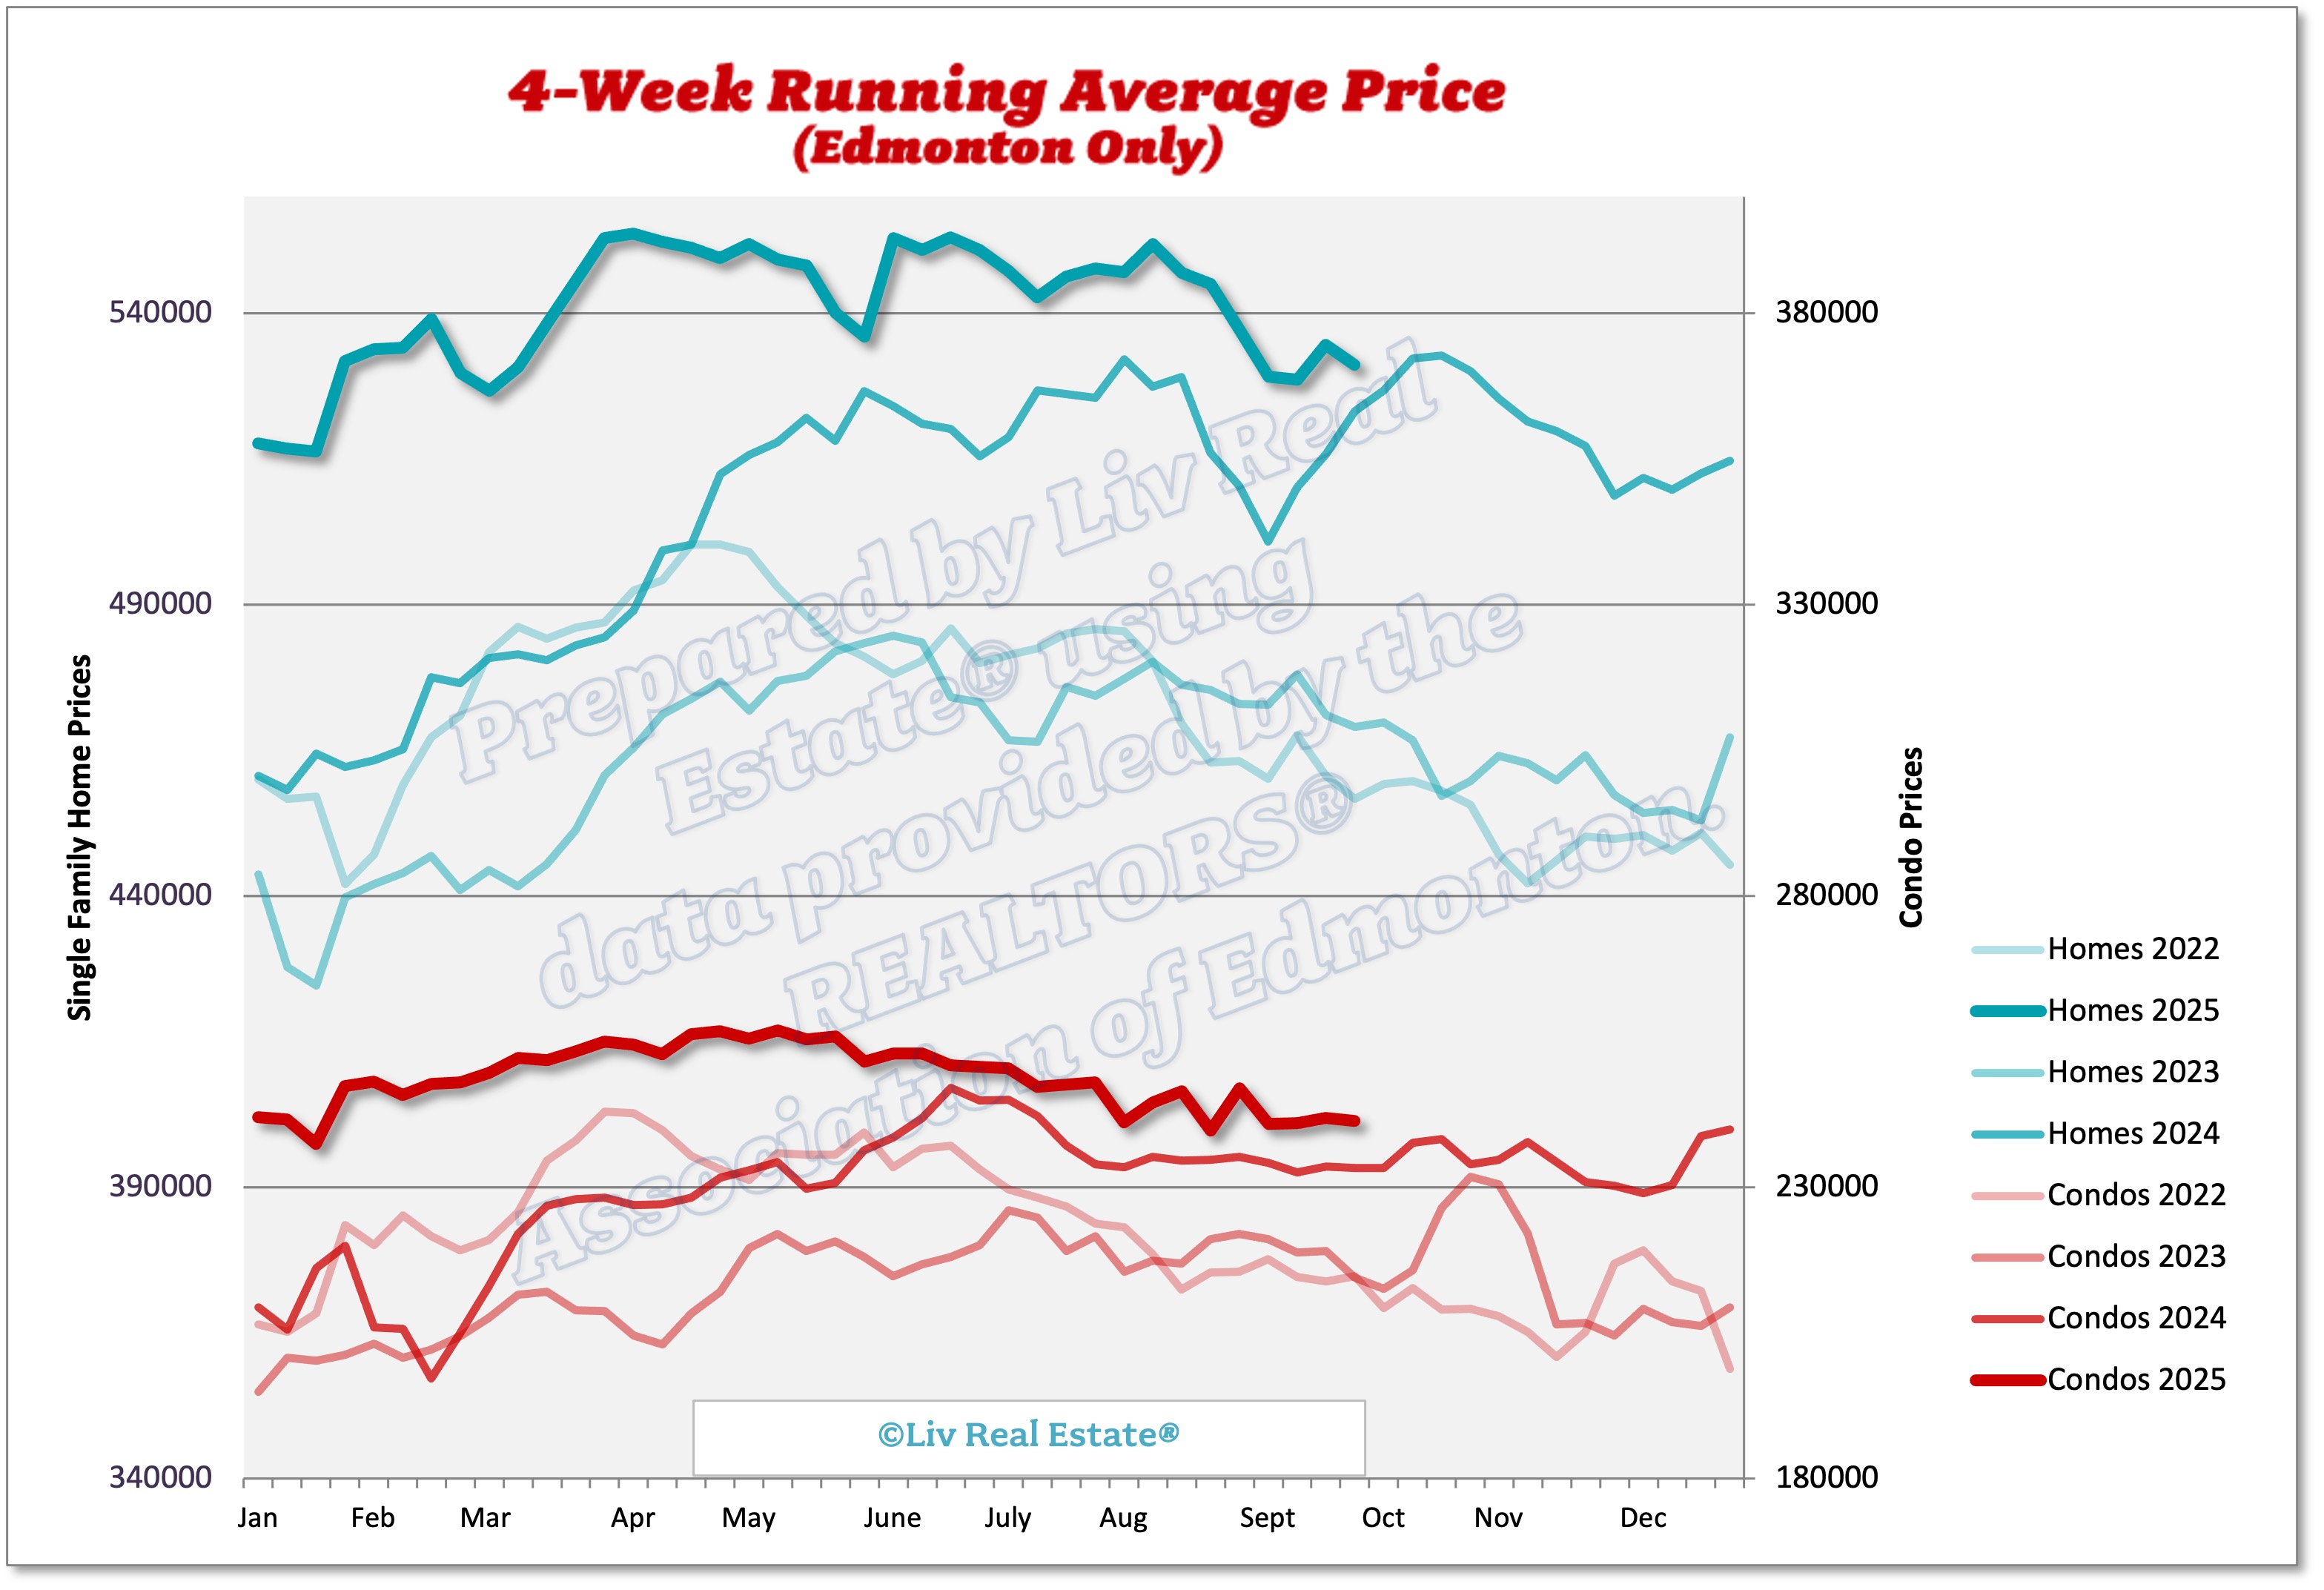
Here is our weekly update on the Edmonton real estate market for the past 7 days: (Previous week's numbers are in brackets). 

New Listings: 650 (478, 431, 449)
Sales: 414 (340, 322, 350)
Ratio: 64% (71%, 75%, 78%)
Price Changes: 244 (190, 160, 141)
Expired/Off-Market Listings: 206 (91, 83, 98)
Net loss/gain in listings this week: 30 (47, 26, 1)
Active single-family home listings: 1629 (1534, 1471, 1436)
Active condo listings: 1071 (1046, 1028, 998)
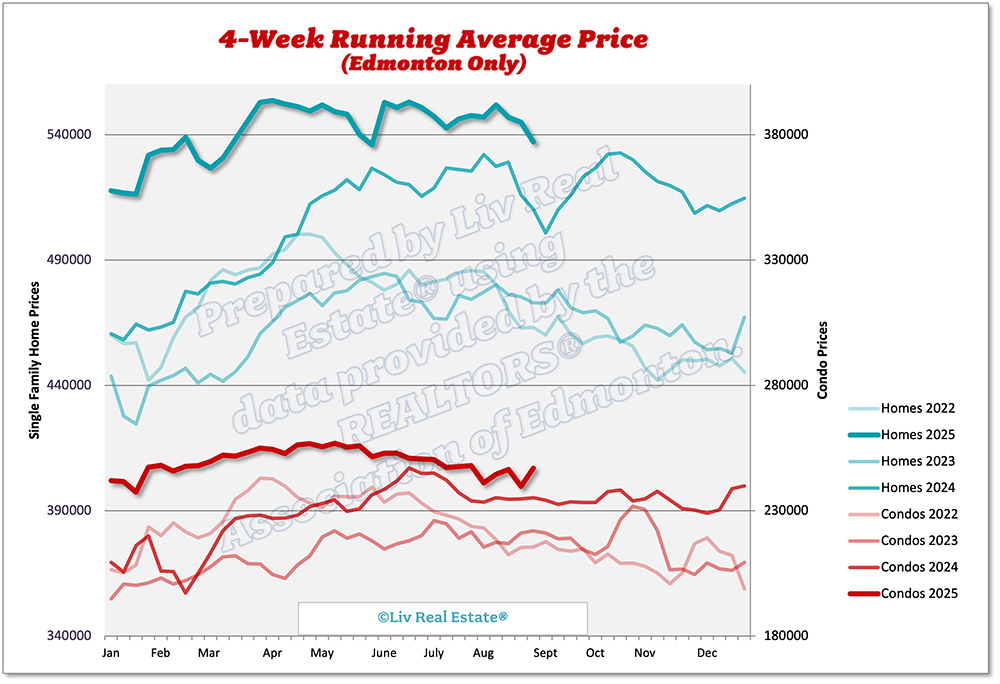
Homes 4-week running average: $531 ($527, $530, $539)
Condos 4-week running average: $252 ($250, $248, $248).


Make sure you also check out our Monthly Market Report for February for a more in-depth look at the factors affecting the local real estate market and the trends we are seeing. 

274 Views, 0 Comments

In February 2025, the real estate market in the Greater Edmonton Area has shown some important trends. By considering economic factors and local conditions, let's look at the key statistics and changes shaping the market.

The average price for single-family homes reached a new high of $505,700, which is a 14% increase from last year. Similarly, apartment-style condos and townhouses also saw price increases of 14% ($207,300) and 19% ($292,800), respectively. These numbers reflect strong demand in the market, even with ongoing uncertainties.

Inventory levels continue to be notably low, with 4,148 listings by the end of February, reflecting a 13% decrease from the previous year.

We started the year with very strong sales in January, but the threat…

467 Views, 0 Comments

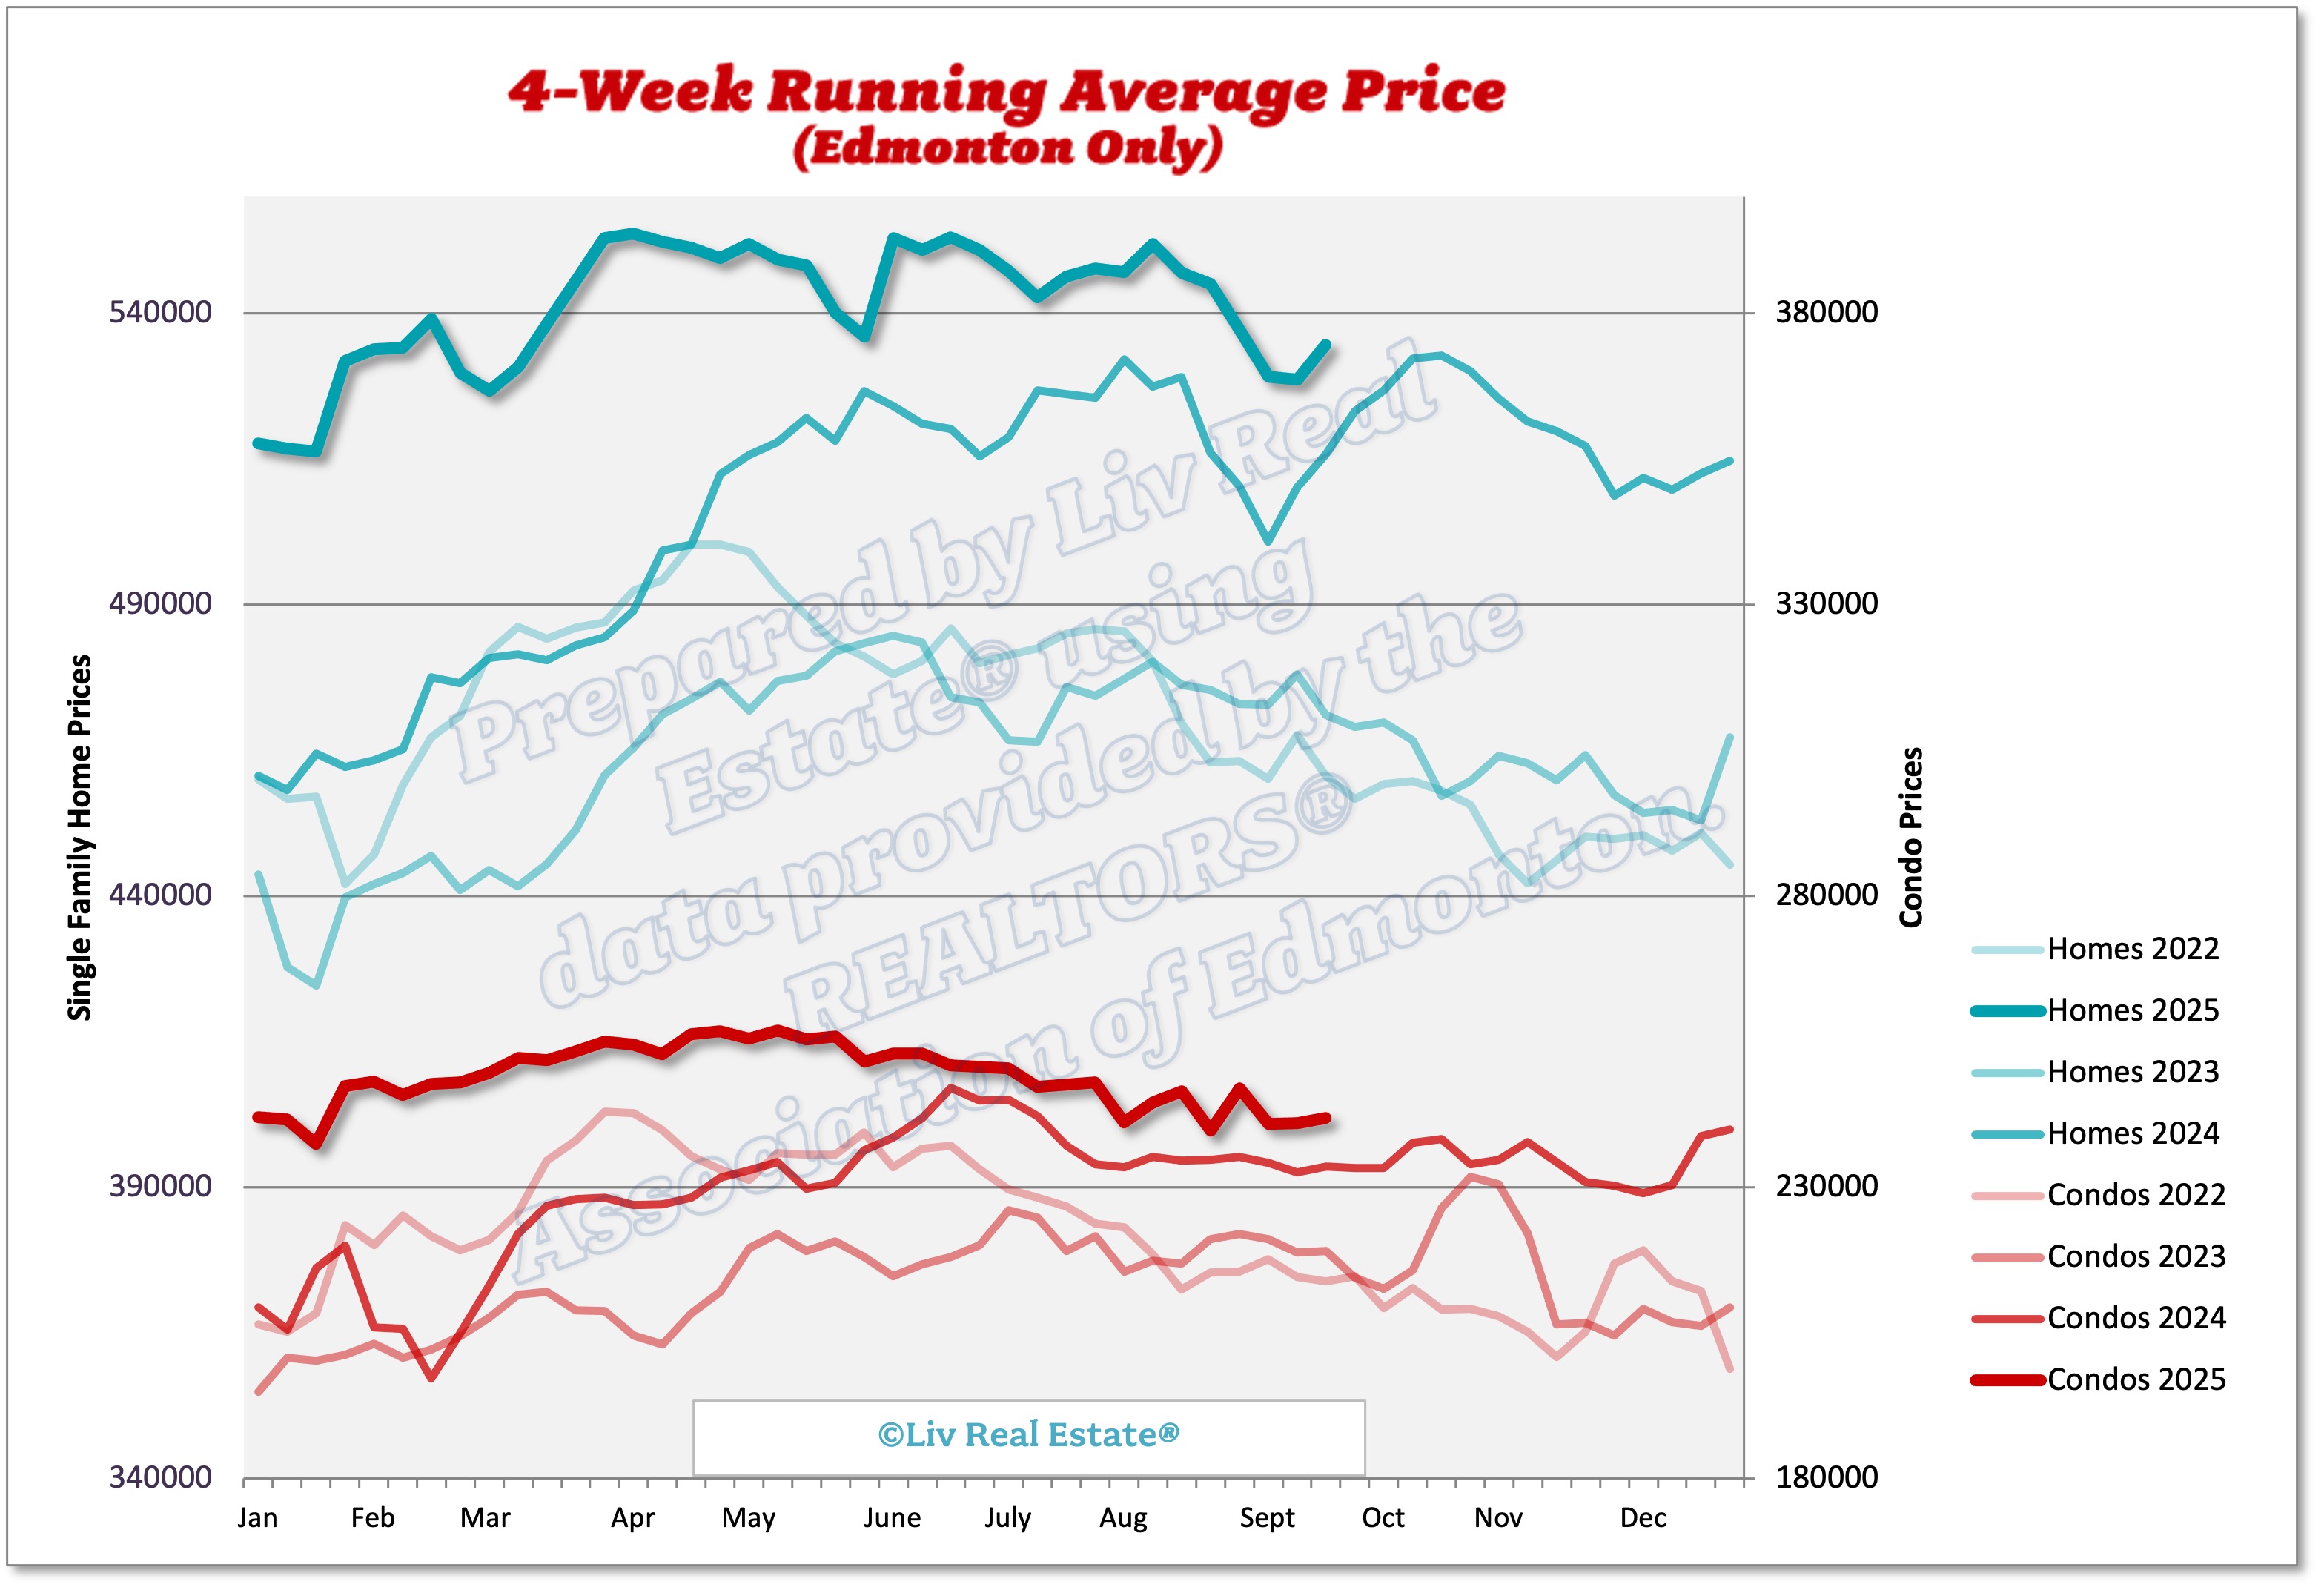
Here is our weekly update on the Edmonton real estate market. (Previous week's numbers are in brackets). For the past 7 days:

New Listings: 478 (431, 449, 460)
Sales: 340 (322, 350, 362)
Ratio: 71% (75%, 78%, 79%)
Price Changes: 190 (160, 141, 172)
Expired/Off-Market Listings: 91 (83, 98, 203)
Net loss/gain in listings this week: 47 (26, 1, -105)
Active single-family home listings: 1534 (1471, 1436, 1376)
Active condo listings: 1046 (1028, 998, 981)
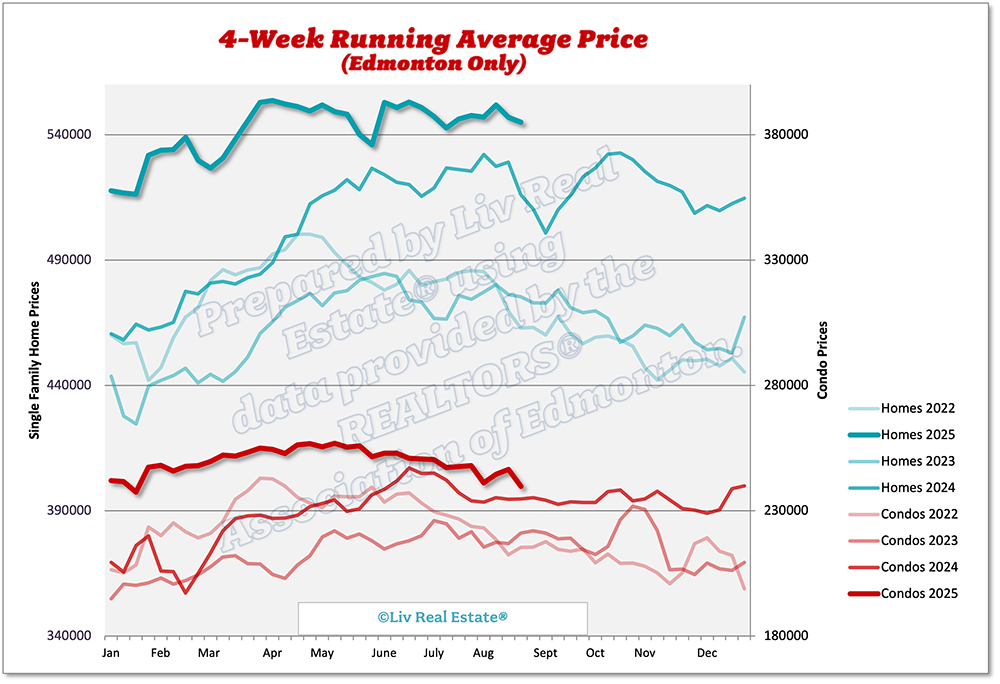
Homes 4-week running average: $527 ($530, $539, $534)
Condos 4-week running average: $250 ($248, $248, $246)

275 Views, 0 Comments

Here is our weekly update on the Edmonton real estate market. (Previous week's numbers are in brackets). For the past 7 days:

New Listings: 431 (449, 460, 368)
Sales: 322 (350, 362, 318)
Ratio: 75% (78%, 79%, 86%)
Price Changes: 160 (141, 172, 132)
Expired/Off-Market Listings: 83 (98, 203, 91)
Net loss/gain in listings this week: 26 (1, -105, -41)
Active single-family home listings: 1471 (1436, 1376, 1354)
Active condo listings: 1028 (998, 981, 973)
Homes 4-week running average: $530 ($539, $534, $534)
Condos 4-week running average: $248 ($248, $246, $248)


288 Views, 0 Comments

Here is our weekly update on the Edmonton real estate market. (Previous week's numbers are in brackets). For the past 7 days:

New Listings: 449 (460, 368, 384)
Sales: 350 (362, 318, 359)
Ratio: 78% (79%, 86%, 93%)
Price Changes: 141 (172, 132, 118)
Expired/Off-Market Listings: 98 (203, 91, 83)
Net loss/gain in listings this week: 1 (-105, -41, -58)
Active single-family home listings: 1436 (1376, 1354, 1365)
Active condo listings: 998 (981, 973, 958)
Homes 4-week running average: $539 ($534, $534, $532)
Condos 4-week running average: $248 ($246, $248, $247)

313 Views, 0 Comments

Here is our weekly update on the Edmonton real estate market. (Previous week's numbers are in brackets). For the past 7 days:

New Listings: 460 (368, 384, 394)
Sales: 362 (318, 359, 282)
Ratio: 79% (86%, 93%, 72%)
Price Changes: 172 (132, 118, 103)
Expired/Off-Market Listings: 203 (91, 83, 121)
Net loss/gain in listings this week: -105 (-41, -58, -9)
Active single-family home listings: 1376 (1354, 1365, 1338)
Active condo listings: 981 (973, 958, 961)
Homes 4-week running average: $534 ($534, $532, $516)
Condos 4-week running average: $246 ($248, $247, $237)

363 Views, 0 Comments


As we analyze January's data for the Greater Edmonton real estate market, remarkable trends emerge. January observed a notable surge in property values, with single-family homes escalating by 14% to reach a benchmark price of $495,700 compared to last year. Apartment-style condos and townhouses were not far behind, marking increases of 9% and 13%, respectively. This surge culminated in the sale of a record-breaking $6 million single-family home, setting a new peak for luxury real estate in the region.

Inventory levels remained low, totalling 3,723 listings—an 18% decrease from the previous year—reflecting a robust seller's market. This is particularly pronounced as Edmonton witnessed 1,597 homes sold in January alone, an 11% increase year over year…

1162 Views, 0 Comments

Here is our weekly update on the Edmonton real estate market. (Previous week's numbers are in brackets). For the past 7 days:

New Listings: 368 (384, 394, 336)
Sales: 318 (359, 282, 219)
Ratio: 86% (93%, 72%, 65%)
Price Changes: 132 (118, 103, 122)
Expired/Off-Market Listings: 91 (83, 121, 122)
Net loss/gain in listings this week: -41 (-58, -9, -5)
Active single-family home listings: 1354 (1365, 1338, 1322)
Active condo listings: 973 (958, 961, 980)
Homes 4-week running average: $534 ($532, $516, $517)
Condos 4-week running average: $248 ($247, $237, $242)

338 Views, 0 Comments