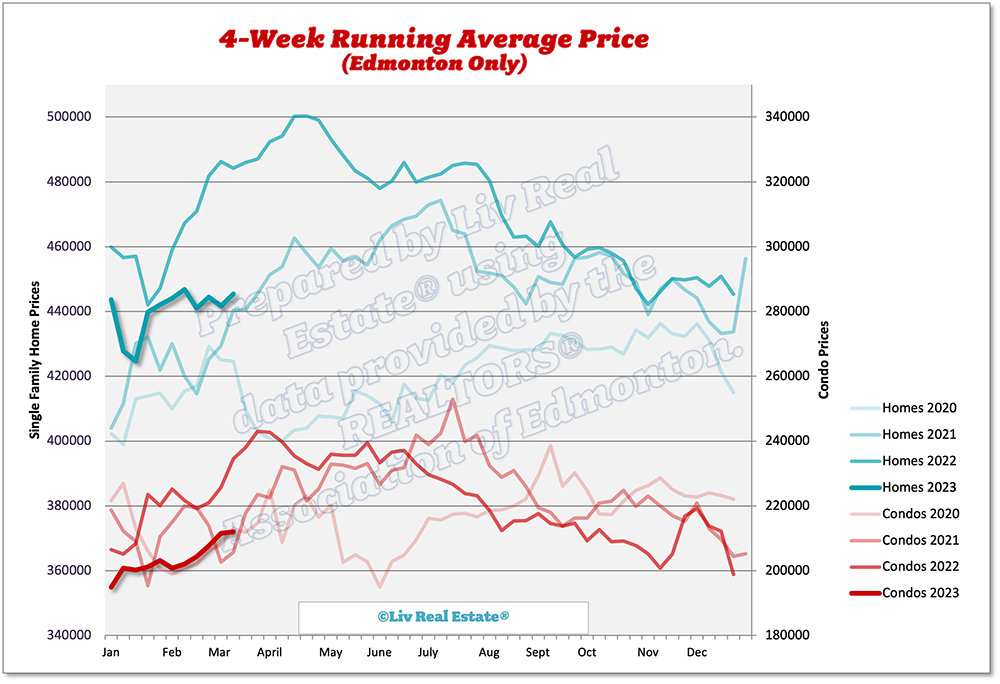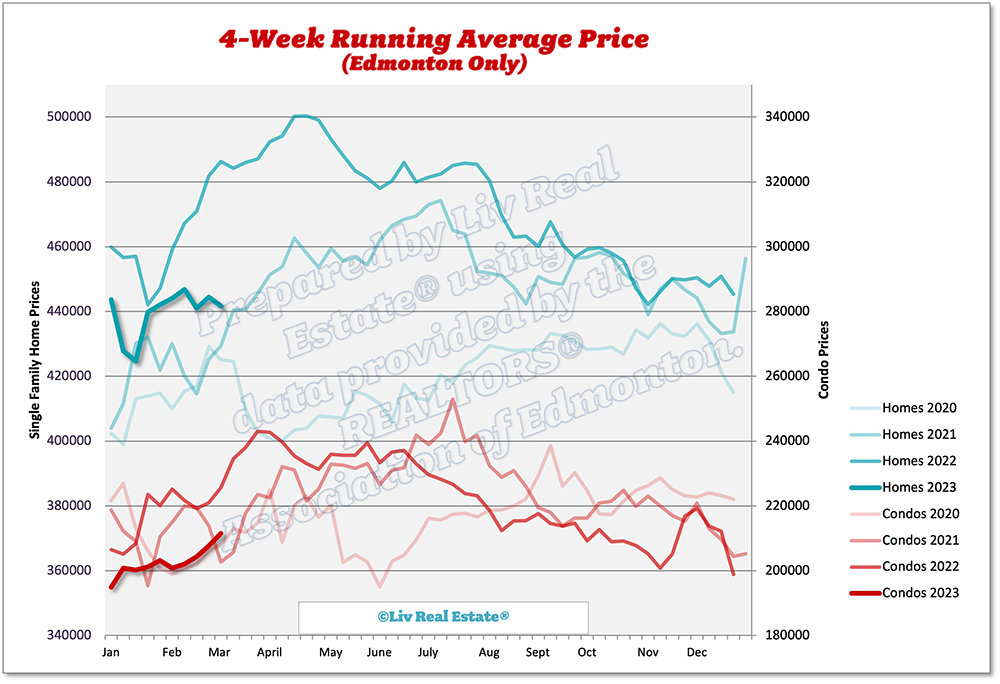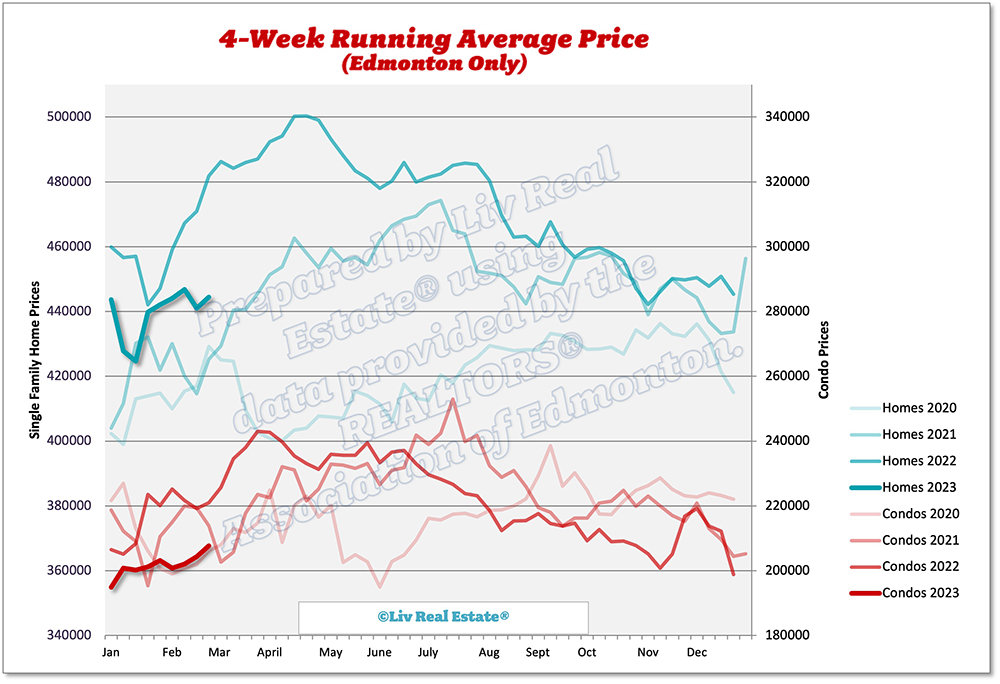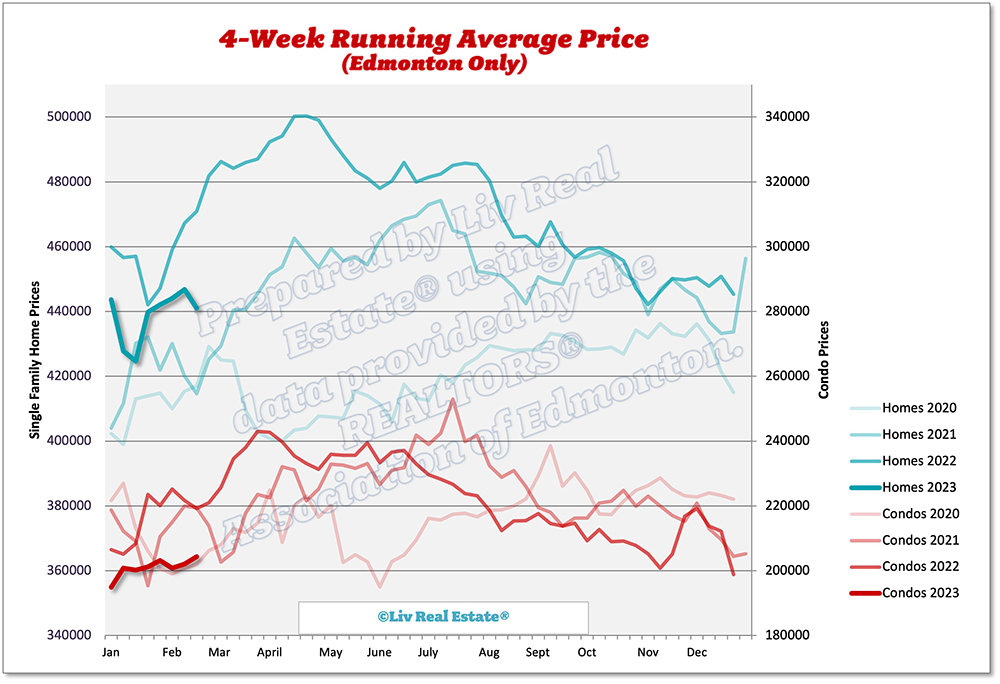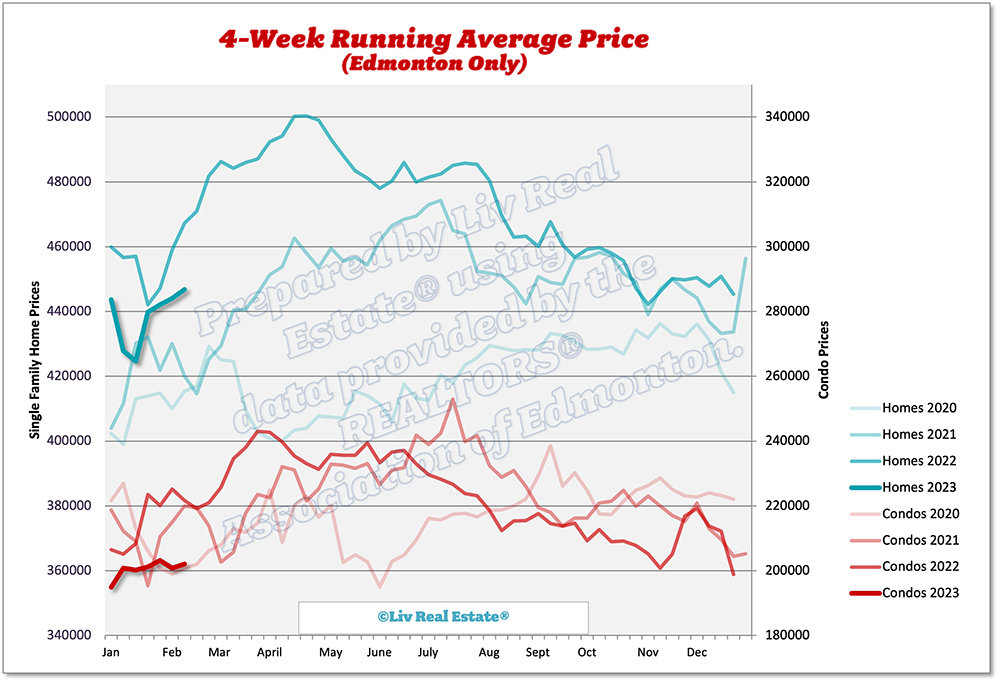
When you compare the current real estate market in the Greater Edmonton Area to 2022, or 2021, things look pretty bleak - sales are down 44% from last March, prices are down 8%, and inventory is up 20% - but when you take a look at the bigger picture, 2023 is looking like one of the best years in at least a decade. Have a look at the charts below, and you'll see what I mean. 

Meanwhile, in Calgary, inventory is at its lowest level for March since 2006!

According to CREB® Chief Economist Ann-Marie Lurie, “The challenge has been centred around supply. As a result, existing homeowners may be reluctant to list as they struggle to find an acceptable housing alternative in this market. At the same time, higher lending rates can also reduce the incentives…

1290 Views, 0 Comments
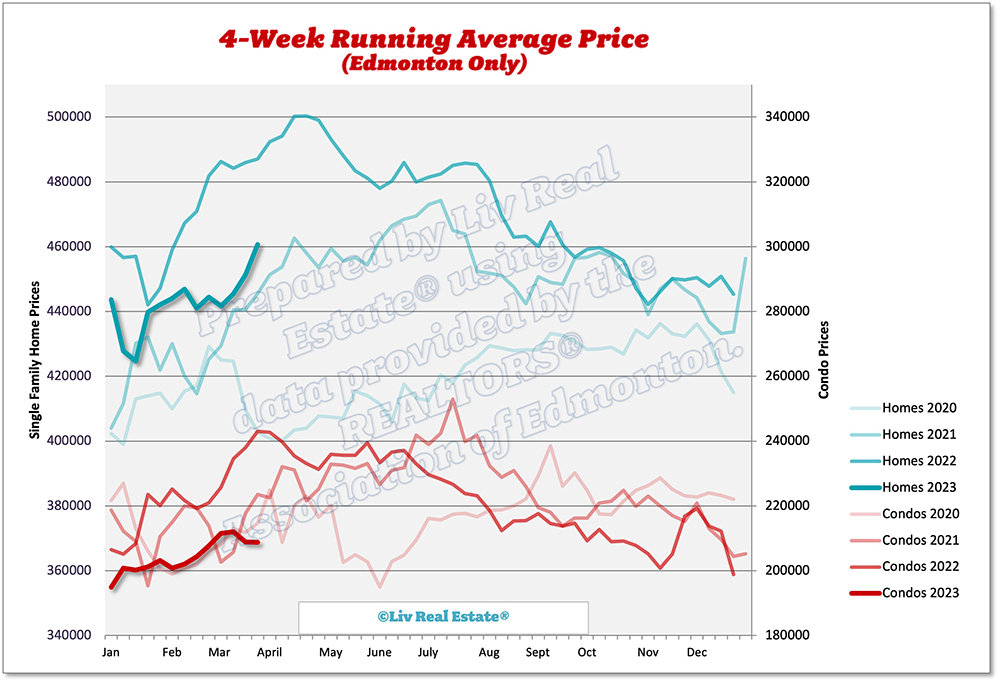
Here is our update on the Edmonton real estate market. (Previous week’s numbers are in brackets). For the past 7 days:

New Listings: 455 (521, 589, 526)
Sales: 323 (334, 306, 292)
Ratio: 71% (64%, 52%, 56%)
Price Changes: 313 (295, 250, 241)
Expired/Off-Market Listings: 161 (159, 171, 138)
Net loss/gain in listings this week: -29 (28, 112, 96)
Active single-family home listings: 2684 (2683, 2644, 2544)
Active condo listings: 1591 (1611, 1590, 1528)
Homes 4-week running average: $461 ($451, $445, $442)
Condos 4-week running average: $209 ($209, $212, $212)

1134 Views, 6 Comments

The 5-year Canada bond yield hit a 12-month low last week, causing fixed mortgage rates to drop.  This unexpected turn of events may be jump starting the spring market as potential buyers can now secure attractive rates. We saw many homebuyers putting their plans on hold due to high interest rates last year, but we're now seeing many of those buyers back are ready to jump into the market.

Here is our update on the Edmonton real estate market. (Previous week’s numbers are in brackets). For the past 7 days:

New Listings: 521 (589, 526, 524)
Sales: 334 (306, 292, 279)
Ratio: 64% (52%, 56%, 53%)
Price Changes: 295 (250, 241, 250)
Expired/Off-Market Listings: 159 (171, 138, 266)
Net loss/gain in listings this week: 28 (112, 96, -21)
Active single-family home…

1004 Views, 1 Comments

Here is our update on the Edmonton real estate market. (Previous week’s numbers are in brackets). For the past 7 days:

New Listings: 589 (526, 524, 433)
Sales: 306 (292, 279, 251)
Ratio: 52% (56%, 53%, 58%)
Price Changes: 250 (241, 250, 228)
Expired/Off-Market Listings: 171 (138, 266, 161)
Net loss/gain in listings this week: 112 (96, -21, 21)
Active single-family home listings: 2644 (2544, 2481, 2462)
Active condo listings: 1590 (1528, 1506, 1483)
Homes 4-week running average: $445 ($442, $444, $441)
Condos 4-week running average: $212 ($212, $208, $204)

938 Views, 0 Comments

Here is our update on the Edmonton real estate market. (Previous week’s numbers are in brackets). For the past 7 days:

New Listings: 526 (524, 433, 522)
Sales: 292 (279, 251, 257)
Ratio: 56% (53%, 58%, 49%)
Price Changes: 241 (250, 228, 223)
Expired/Off-Market Listings: 138 (266, 161, 160)
Net loss/gain in listings this week: 96 (-21, 21, 105)
Active single-family home listings: 2544 (2481, 2462, 2464)
Active condo listings: 1528 (1506, 1483, 1480)
Homes 4-week running average: $442 ($444, $441, $447)
Condos 4-week running average: $212 ($208, $204, $202)

916 Views, 0 Comments

Here is our update on the Edmonton real estate market. (Previous week’s numbers are in brackets). For the past 7 days:

New Listings: 524 (433, 522, 475)
Sales: 279 (251, 257, 240)
Ratio: 53% (58%, 49%, 51%)
Price Changes: 250 (228, 223, 243)
Expired/Off-Market Listings: 266 (161, 160, 158)
Net loss/gain in listings this week: -21 (21, 105, 77)
Active single-family home listings: 2481 (2462, 2464, 2373)
Active condo listings: 1506 (1483, 1480, 1449)
Homes 4-week running average: $444 ($441, $447, $444)
Condos 4-week running average: $208 ($204, $202, $201)

998 Views, 0 Comments

This is one of those times when the stats don't seem to match what is happening in reality. Yesterday, our brokerage held our first-ever "Liv Better Day": where we learned a ton, celebrated our award winners (we give out awards for customer service excellence, leadership, community involvement and teamwork, not sales), and ended the day with a charity challenge where we gave away $4500 to local charities. I had a chance to discuss the market with a lot of our agents, and the stories I kept hearing were of multiple offers. Well priced, well marketed listings are getting a lot of interest from buyers in the Edmonton area. 

When you glance at the numbers below, they seem to suggest the market is slow. But really, we're comparing what has started off as a…

1603 Views, 1 Comments

Here is our update on the Edmonton real estate market. (Previous week’s numbers are in brackets). For the past 7 days:

New Listings: 433 (522, 475, 461)
Sales: 251 (257, 240, 233)
Ratio: 58% (49%, 51%. 51%)
Price Changes: 228 (223, 243, 219)
Expired/Off-Market Listings: 161 (160, 158, 336)
Net loss/gain in listings this week: 21 (105, 77, -108)
Active single-family home listings: 2462 (2464, 2373, 2321)
Active condo listings: 1483 (1480, 1449, 1426)
Homes 4-week running average: $441 ($447, $444, $442)
Condos 4-week running average: $204 ($202, $201, $203)

1113 Views, 3 Comments

Here is our update on the Edmonton real estate market. (Previous week’s numbers are in brackets). For the past 7 days:

New Listings: 522 (475, 461, 410)
Sales: 257 (240, 233, 212)
Ratio: 49% (51%. 51%, 52%)
Price Changes: 223 (243, 219, 234)
Expired/Off-Market Listings: 160 (158, 336, 149)
Net loss/gain in listings this week: 105 (77, -108, 49)
Active single-family home listings: 2464 (2373, 2321, 2364)
Active condo listings: 1480 (1449, 1426, 1463)
Homes 4-week running average: $447 ($444, $442, $440)
Condos 4-week running average: $202 ($201, $203, $201)


960 Views, 0 Comments

Here is our update on the Edmonton real estate market. (Previous week’s numbers are in brackets). For the past 7 days:

New Listings: 475 (461, 410, 469)
Sales: 240 (233, 212, 166)
Ratio: 51% (51%, 52%, 35%)
Price Changes: 243 (219, 234, 268)
Expired/Off-Market Listings: 158 (336, 149, 198)
Net loss/gain in listings this week: 77 (-108, 49, 105)
Active single-family home listings: 2373 (2321, 2364, 2335)
Active condo listings: 1449 (1426, 1463, 1470)
Homes 4-week running average: $444 ($442, $440, $425)
Condos 4-week running average: $201 ($203, $201, $200)

1019 Views, 0 Comments