Here is our update on the Edmonton real estate market. (Previous week’s numbers are in brackets). For the past 7 days:

New Listings: 469 (418, 296, 103)
Sales: 166 (156, 116, 129)
Ratio: 35% (37%, 39%, 125%)
Price Changes: 268 (230, 145, 69)
Expired/Off-Market Listings: 198 (185, 667, 160)
Net loss/gain in listings this week: 105 (77, -487, -186)
Active single-family home listings: 2335 (2280, 2252, 2577)
Active condo listings: 1470 (1438, 1388, 1540)
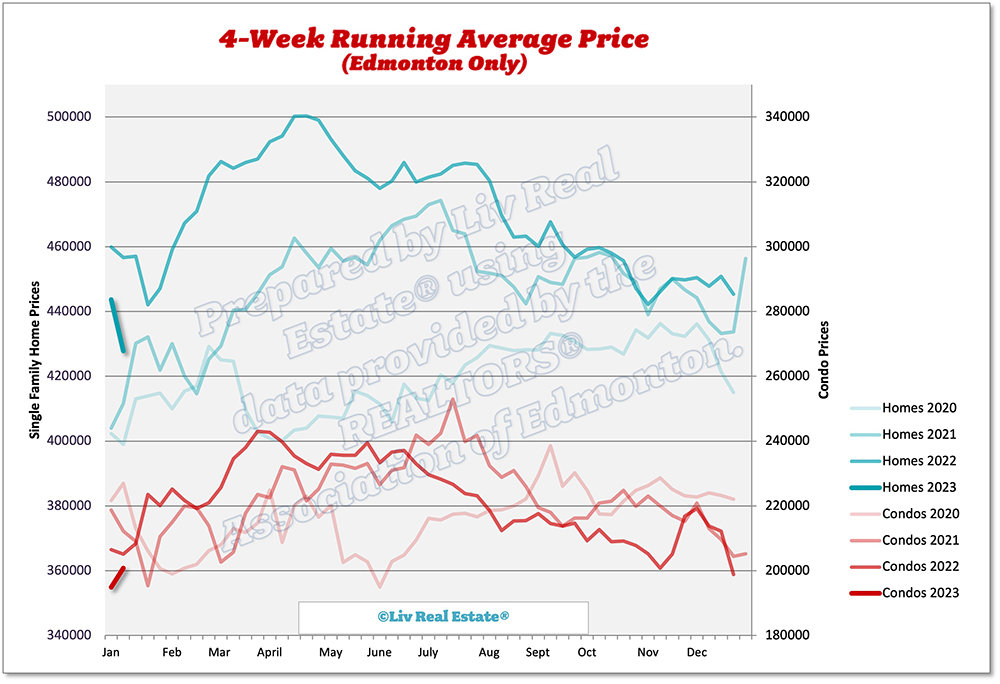
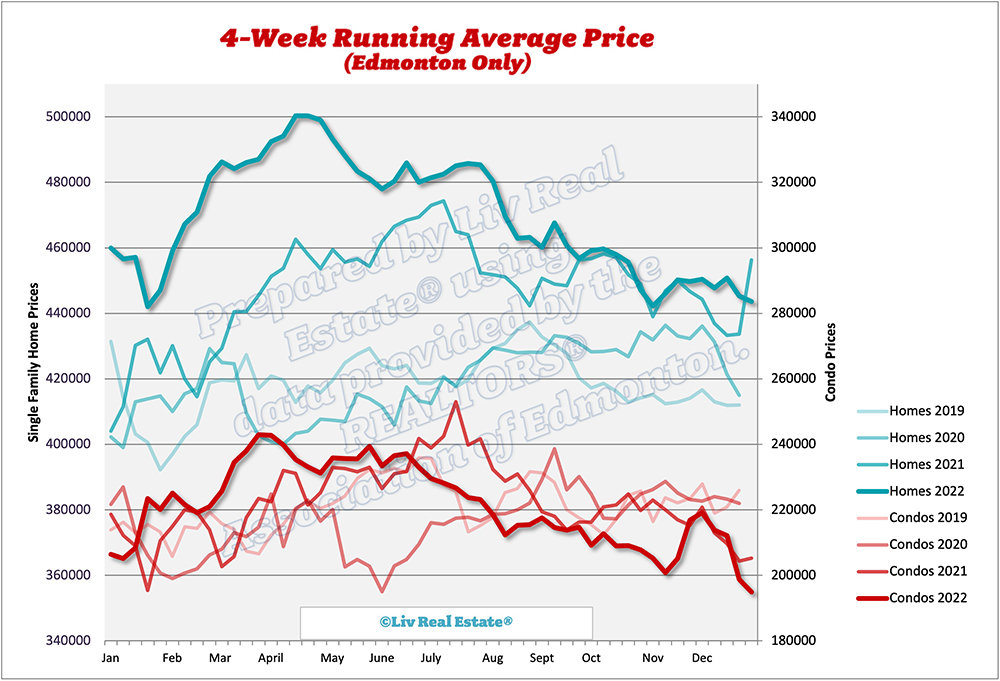
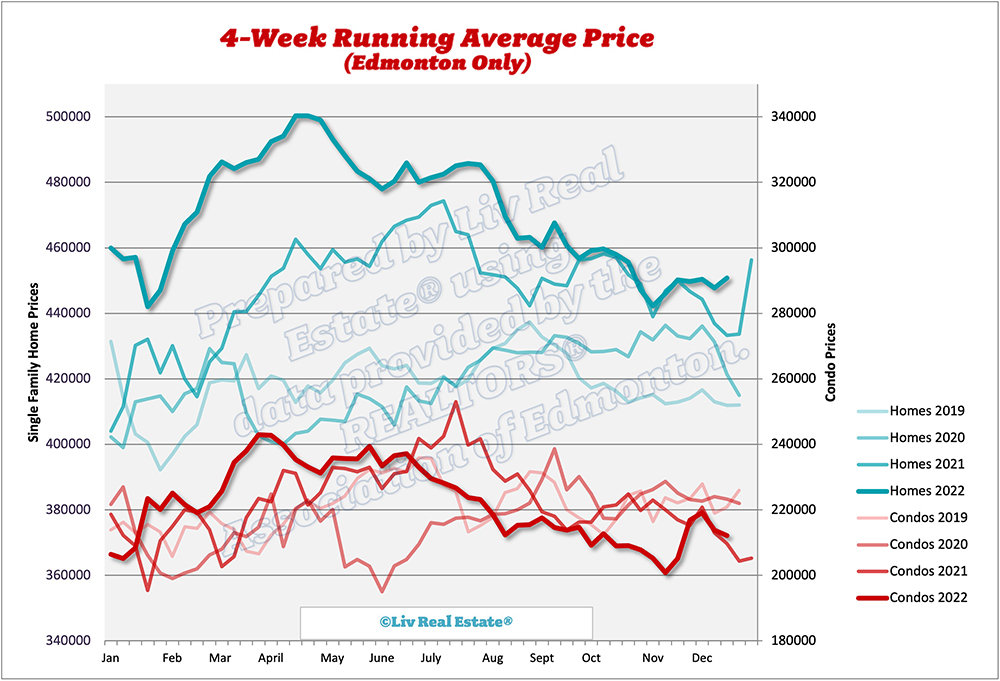
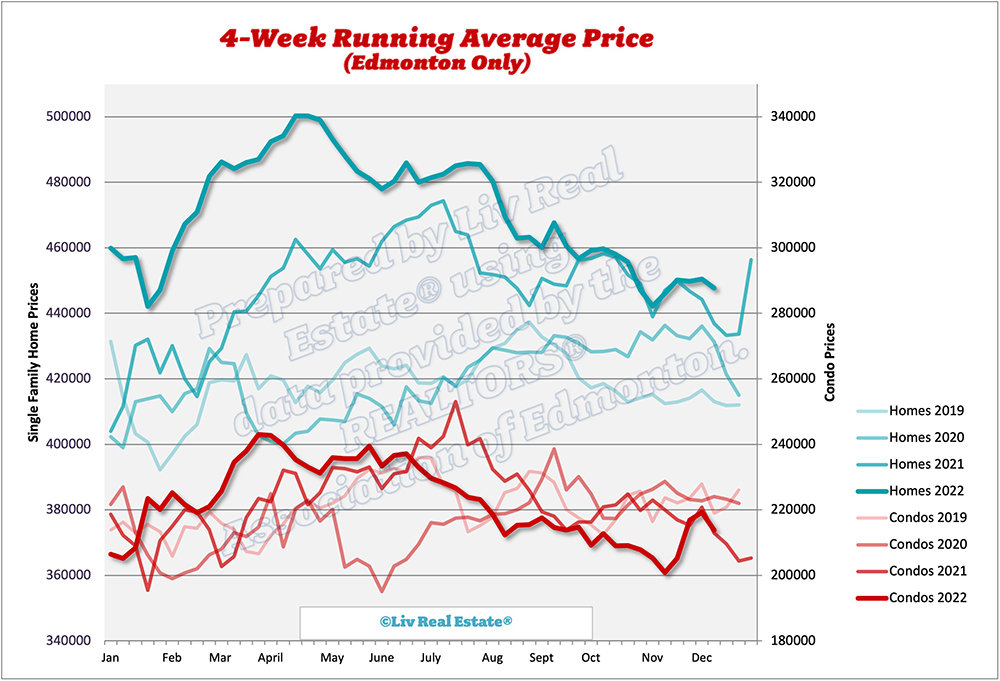
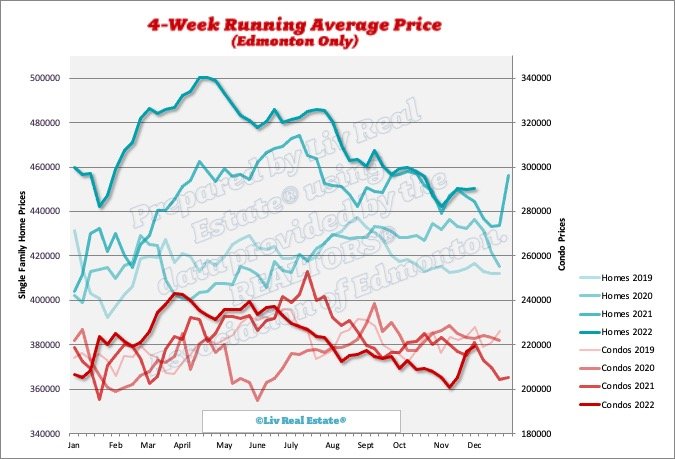
Homes 4-week running average: $425 ($428, $444, $445)
Condos 4-week running average: $200 ($201, $195, $199)


1104 Views, 3 Comments

Here is our update on the Edmonton real estate market. (Previous week’s numbers are in brackets). For the past 7 days:

New Listings: 418 (296, 103, 178)
Sales: 156 (116, 129, 217)
Ratio: 37% (39%, 125%, 122%)
Price Changes: 230 (145, 69, 101)
Expired/Off-Market Listings: 185 (667, 160, 288)
Net loss/gain in listings this week: 77 (-487, -186, -327)
Active single-family home listings: 2280 (2252, 2577, 2649)
Active condo listings: 1438 (1388, 1540, 1572)
Homes 4-week running average: $428 ($444, $445, $451)
Condos 4-week running average: $201 ($195, $199, $212)

943 Views, 2 Comments


The greater Edmonton area real estate market remains balanced, with just over 5 months of inventory. The benchmark price has remained stable again this month, declining just under 1%, while sales dropped 26% compared to last year. Sales are still slightly higher than they usually are at this time of year and higher than we saw before the pandemic. Inventory has risen 11% over last year but remains in the normal range. 

City of Edmonton Stats

Single Family home sales have decreased from last year and are now at pre-pandemic levels, while condo sales have increased over last year. 


1307 Views, 0 Comments

Here is our update on the Edmonton real estate market. (Previous week’s numbers are in brackets). For the past 7 days:

New Listings: 296 (103, 178, 270)
Sales: 116 (129, 217, 210)
Ratio: 39% (125%, 122%, 78%)
Price Changes: 145 (69, 101, 174)
Expired/Off-Market Listings: 667 (160, 288, 298, 224)
Net loss/gain in listings this week: -487 (-186, -327, -238)
Active single-family home listings: 2252 (2577, 2649, 2753)
Active condo listings: 1388 (1540, 1572, 1635)
Homes 4-week running average: $444 ($445, $451, $448)
Condos 4-week running average: $195 ($199, $212, $213)

Happy New Year! 

901 Views, 2 Comments

Here is our update on the Edmonton real estate market. (Previous week’s numbers are in brackets). For the past 7 days:

New Listings: 103 (178, 270, 310)
Sales: 129 (217, 210, 189)
Ratio: 124% (122%, 78%, 61%)
Price Changes: 69 (101, 174, 225)
Expired/Off-Market Listings: 160 (288, 298, 224)
Net loss/gain in listings this week: -186 (-327, -238, -103)
Active single-family home listings: 2577 (2649, 2753, 2870)
Active condo listings: 1540 (1572, 1635, 1721)
Homes 4-week running average: $445 ($451, $448, $450)
Condos 4-week running average: $199 ($212, $213, $219)

930 Views, 1 Comments

Here is our update on the Edmonton real estate market. (Previous week’s numbers are in brackets). For the past 7 days:

New Listings: 178 (270, 310, 305)
Sales: 217 (210, 189, 189)
Ratio: 122% (78%, 61%, 62%)
Price Changes: 101 (174, 225, 290)
Expired/Off-Market Listings: 288 (298, 224, 472)
Net loss/gain in listings this week: -327 (-238, -103, -356)
Active single-family home listings: 2649 (2753, 2870, 2916)
Active condo listings: 1572 (1635, 1721, 1724)
Homes 4-week running average: $451 ($448, $450, $450)
Condos 4-week running average: $212 ($213, $219, $217)

Happy Holidays! 

924 Views, 1 Comments

Here is our update on the Edmonton real estate market. (Previous week’s numbers are in brackets). For the past 7 days:

New Listings: 270 (310, 305, 342)
Sales: 210 (189, 189, 202)
Ratio: 78% (61%, 62%, 59%)
Price Changes: 174 (225, 290, 246)
Expired/Off-Market Listings: 298 (224, 472, 245)
Net loss/gain in listings this week: -238 (-103, -356, -105)
Active single-family home listings: 2753 (2870, 2916, 3118)
Active condo listings: 1635 (1721, 1724, 1852)
Homes 4-week running average: $448 ($450, $450, $450)
Condos 4-week running average: $213 ($219, $217, $205)


899 Views, 0 Comments

Here is our update on the Edmonton real estate market. (Previous week’s numbers are in brackets). For the past 7 days:

New Listings: 310 (305, 342, 345)
Sales: 189 (189, 202, 216)
Ratio: 61% (62%, 59%, 63%)
Price Changes: 225 (290, 246, 297)
Expired/Off-Market Listings: 224 (472, 245, 278)
Net loss/gain in listings this week: -103 (-356, -105, -149)
Active single-family home listings: 2870 (2916, 3118, 3161)
Active condo listings: 1721 (1724, 1852, 1884)
Homes 4-week running average: $450 ($450, $450, $446)
Condos 4-week running average: $219 ($217, $205, $201)


887 Views, 0 Comments

The greater Edmonton area real estate market remains in a balanced state. The benchmark price has remained remarkably stable, declining just less than 1%, while sales dropped 30% compared to last year. Sales are still slightly higher than they usually are at this time of year and higher than we saw before the pandemic. Inventory has risen 10% over last year but remains in the normal range. 


City of Edmonton Stats

997 Views, 1 Comments

Here is our update on the Edmonton real estate market. (Previous week’s numbers are in brackets). For the past 7 days:

New Listings: 305 (342, 345, 423)
Sales: 189 (202, 216, 230)
Ratio: 62% (59%, 63%, 54%)
Price Changes: 290 (246, 297, 327)
Expired/Off-Market Listings: 472 (245, 278, 292)
Net loss/gain in listings this week: -356 (-105, -149, -99)
Active single-family home listings: 2916 (3118, 3161, 3226)
Active condo listings: 1724 (1852, 1884, 1912)
Homes 4-week running average: $450 ($450, $446, $442)
Condos 4-week running average: $217 ($205, $201, $205)

990 Views, 3 Comments