
Weekly Market Update Sept.3/21
Posted by Liv Real Estate on
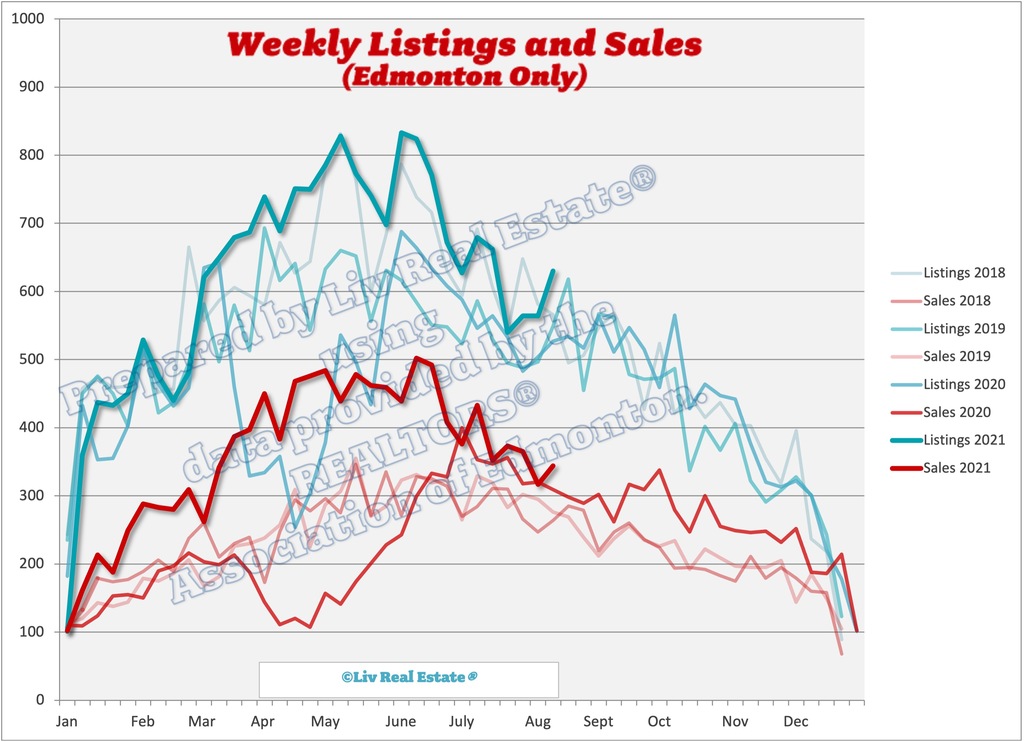
 Here is our update on the Edmonton real estate market. (Previous week’s numbers are in brackets). For the past 7 days:
New Listings: 542 (548, 652, 630)
# Sales: 341 (335, 343, 344)
Ratio: 63% (61%, 53%, 55%)
# Price Changes: 446 (432, 367, 446)
Expired/Off-Market Listings: 566 (236, 277, 230)
Net loss/gain in listings this week: -365 (-23, 32, 56)
Active single-family home listings: 3213 (3390, 3399, 3355)
Active condo listings: 2806 (2978, 2986, 2938)
Homes 4-week running average: $451 ($442, $448, $451)
Condos 4-week running average: $219 ($226, $231, $229)
Here is our update on the Edmonton real estate market. (Previous week’s numbers are in brackets). For the past 7 days:
New Listings: 542 (548, 652, 630)
# Sales: 341 (335, 343, 344)
Ratio: 63% (61%, 53%, 55%)
# Price Changes: 446 (432, 367, 446)
Expired/Off-Market Listings: 566 (236, 277, 230)
Net loss/gain in listings this week: -365 (-23, 32, 56)
Active single-family home listings: 3213 (3390, 3399, 3355)
Active condo listings: 2806 (2978, 2986, 2938)
Homes 4-week running average: $451 ($442, $448, $451)
Condos 4-week running average: $219 ($226, $231, $229)
566 Views, 12 Comments
 Both listings and sales remain above normal levels in the Greater Edmonton Area, which kept the inventory in the normal range (although slightly up from last year). Things shifted closer to balance but we're still hanging on to a seller's market with just under four months of supply (3.74 months to be exact). The benchmark price was up 5.7% from last year with single-family homes leading the way (up 6.8%). There is more interest in condos than we saw last year, but sales are still well below the normal level.
 Here is our update on the Edmonton real estate market. (Previous week’s numbers are in brackets). For the past 7 days:
New Listings: 548 (652, 630, 564)
# Sales: 335 (343, 344, 317)
Ratio: 61% (53%, 55%, 56%)
# Price Changes: 432 (367, 446, 446)
Expired/Off-Market Listings: 236 (277, 230, 470)
Net loss/gain in listings this week: -23 (32, 56, -223)
Active single-family home listings: 3390 (3399, 3355, 330)
Active condo listings: 2978 (2986, 2938, 2909)
Homes 4-week running average: $442 ($448, $451, $452)
Condos 4-week running average: $226 ($231, $229, $232)
Here is our update on the Edmonton real estate market. (Previous week’s numbers are in brackets). For the past 7 days:
New Listings: 548 (652, 630, 564)
# Sales: 335 (343, 344, 317)
Ratio: 61% (53%, 55%, 56%)
# Price Changes: 432 (367, 446, 446)
Expired/Off-Market Listings: 236 (277, 230, 470)
Net loss/gain in listings this week: -23 (32, 56, -223)
Active single-family home listings: 3390 (3399, 3355, 330)
Active condo listings: 2978 (2986, 2938, 2909)
Homes 4-week running average: $442 ($448, $451, $452)
Condos 4-week running average: $226 ($231, $229, $232)
 Here is our update on the Edmonton real estate market. (Previous week’s numbers are in brackets). For the past 7 days:
New Listings: 652 (630, 564, 564)
# Sales: 343 (344, 317, 365)
Ratio: 53% (55%, 56%, 65%)
# Price Changes: 367 (446, 446, 471)
Expired/Off-Market Listings: 277 (230, 470, 221)
Net loss/gain in listings this week: 32 (56, -223, -22)
Active single-family home listings: 3399 (3355, 3301, 3400)
Active condo listings: 2986 (2938, 2909, 3039)
Homes 4-week running average: $448 ($451, $452, $452)
Condos 4-week running average: $231 ($229, $232, $242)
Here is our update on the Edmonton real estate market. (Previous week’s numbers are in brackets). For the past 7 days:
New Listings: 652 (630, 564, 564)
# Sales: 343 (344, 317, 365)
Ratio: 53% (55%, 56%, 65%)
# Price Changes: 367 (446, 446, 471)
Expired/Off-Market Listings: 277 (230, 470, 221)
Net loss/gain in listings this week: 32 (56, -223, -22)
Active single-family home listings: 3399 (3355, 3301, 3400)
Active condo listings: 2986 (2938, 2909, 3039)
Homes 4-week running average: $448 ($451, $452, $452)
Condos 4-week running average: $231 ($229, $232, $242)
 Here is our update on the Edmonton real estate market. (Previous week’s numbers are in brackets). For the past 7 days:
New Listings: 564 (564, 540, 662)
# Sales: 317 (365, 373, 352)
Ratio: 56% (65%, 69%, 53%)
# Price Changes: 446 (471, 451, 468)
Expired/Off-Market Listings: 470 (221, 232, 240)
Net loss/gain in listings this week: -223 (-22, -65, 70)
Active single-family home listings: 3301 (3400, 3385, 3415)
Active condo listings: 2909 (3039, 3021, 3044)
Homes 4-week running average: $452 ($452, $464, $465)
Condos 4-week running average: $232 ($242, $240, $253)
Here is our update on the Edmonton real estate market. (Previous week’s numbers are in brackets). For the past 7 days:
New Listings: 564 (564, 540, 662)
# Sales: 317 (365, 373, 352)
Ratio: 56% (65%, 69%, 53%)
# Price Changes: 446 (471, 451, 468)
Expired/Off-Market Listings: 470 (221, 232, 240)
Net loss/gain in listings this week: -223 (-22, -65, 70)
Active single-family home listings: 3301 (3400, 3385, 3415)
Active condo listings: 2909 (3039, 3021, 3044)
Homes 4-week running average: $452 ($452, $464, $465)
Condos 4-week running average: $232 ($242, $240, $253)
 Here is our update on the Edmonton real estate market. (Previous week’s numbers are in brackets). For the past 7 days:
New Listings: 564 (540, 662, 679)
# Sales: 365 (373, 352, 433)
Ratio: 65% (69%, 53%, 64%)
# Price Changes: 471 (451, 468, 484)
Expired/Off-Market Listings: 221 (232, 240, 223)
Net loss/gain in listings this week: -22 (-65, 70, 23)
Active single-family home listings: 3400 (3385, 3415, 3362)
Active condo listings: 3039 (3021, 3044, 3024)
Homes 4-week running average: $452 ($464, $465, $474)
Condos 4-week running average: $242 ($240, $253, $242)
Here is our update on the Edmonton real estate market. (Previous week’s numbers are in brackets). For the past 7 days:
New Listings: 564 (540, 662, 679)
# Sales: 365 (373, 352, 433)
Ratio: 65% (69%, 53%, 64%)
# Price Changes: 471 (451, 468, 484)
Expired/Off-Market Listings: 221 (232, 240, 223)
Net loss/gain in listings this week: -22 (-65, 70, 23)
Active single-family home listings: 3400 (3385, 3415, 3362)
Active condo listings: 3039 (3021, 3044, 3024)
Homes 4-week running average: $452 ($464, $465, $474)
Condos 4-week running average: $242 ($240, $253, $242)
 Here is our update on the Edmonton real estate market. (Previous week’s numbers are in brackets). For the past 7 days:
New Listings: 662 (679, 627, 672)
# Sales: 352 (433, 376, 408)
Ratio: 53% (64%, 60%, 61%)
# Price Changes: 468 (484, 443, 445)
Expired/Off-Market Listings: 240 (223, 380, 211)
Net loss/gain in listings this week: 70 (23, -129, 53)
Active single-family home listings: 3415 (3362, 3265, 3250)
Active condo listings: 3044 (3024, 3010, 3108)
Homes 4-week running average: $465 ($474, $473, $469)
Condos 4-week running average: $253 ($242, $239, $242)
Here is our update on the Edmonton real estate market. (Previous week’s numbers are in brackets). For the past 7 days:
New Listings: 662 (679, 627, 672)
# Sales: 352 (433, 376, 408)
Ratio: 53% (64%, 60%, 61%)
# Price Changes: 468 (484, 443, 445)
Expired/Off-Market Listings: 240 (223, 380, 211)
Net loss/gain in listings this week: 70 (23, -129, 53)
Active single-family home listings: 3415 (3362, 3265, 3250)
Active condo listings: 3044 (3024, 3010, 3108)
Homes 4-week running average: $465 ($474, $473, $469)
Condos 4-week running average: $253 ($242, $239, $242)