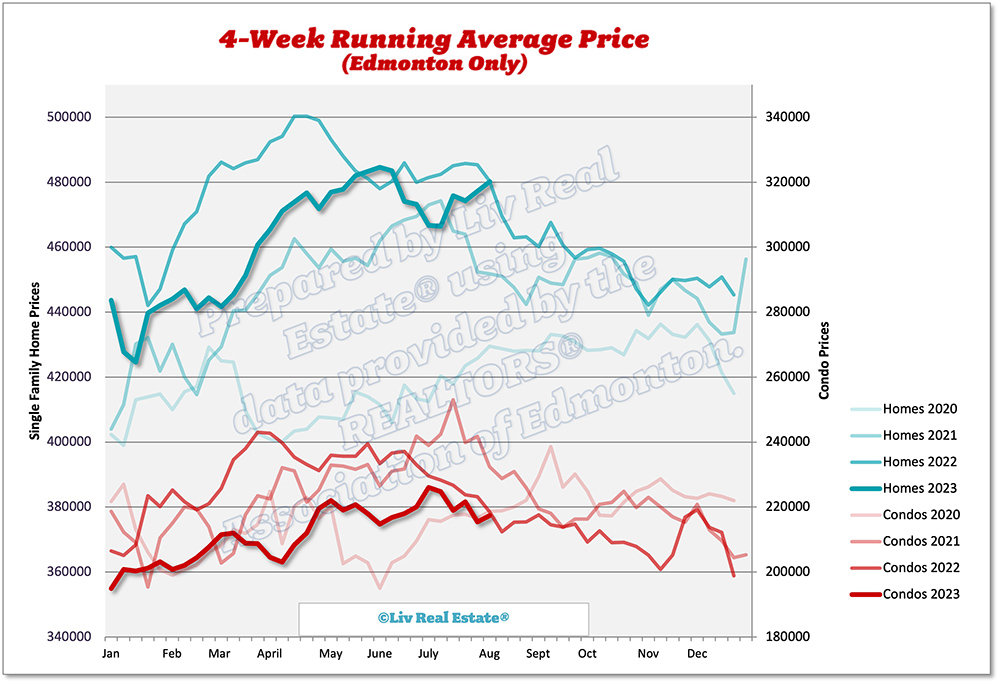
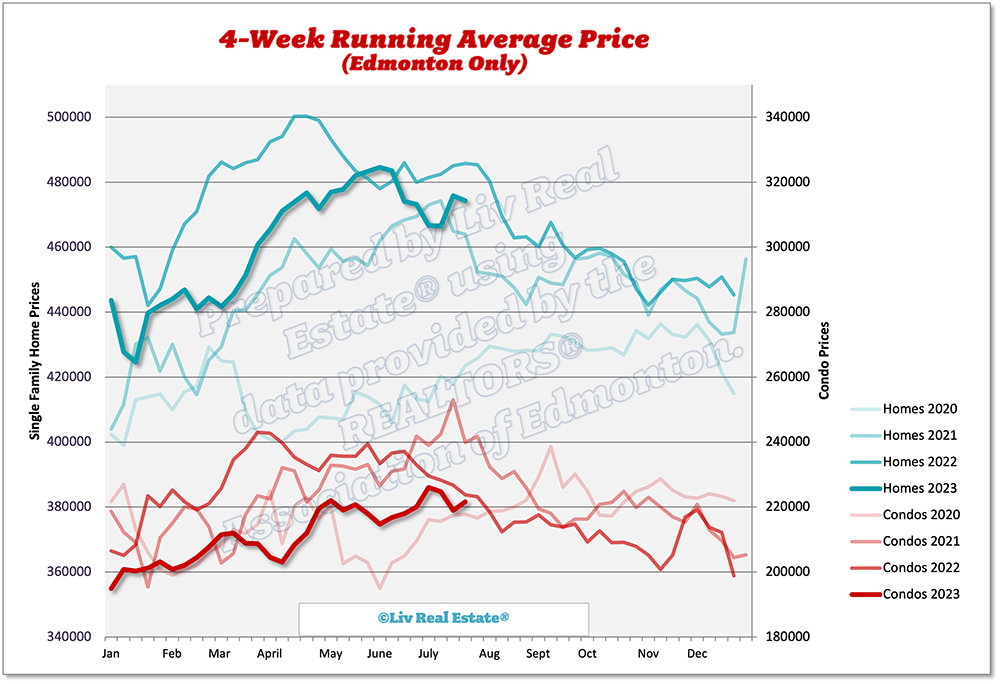
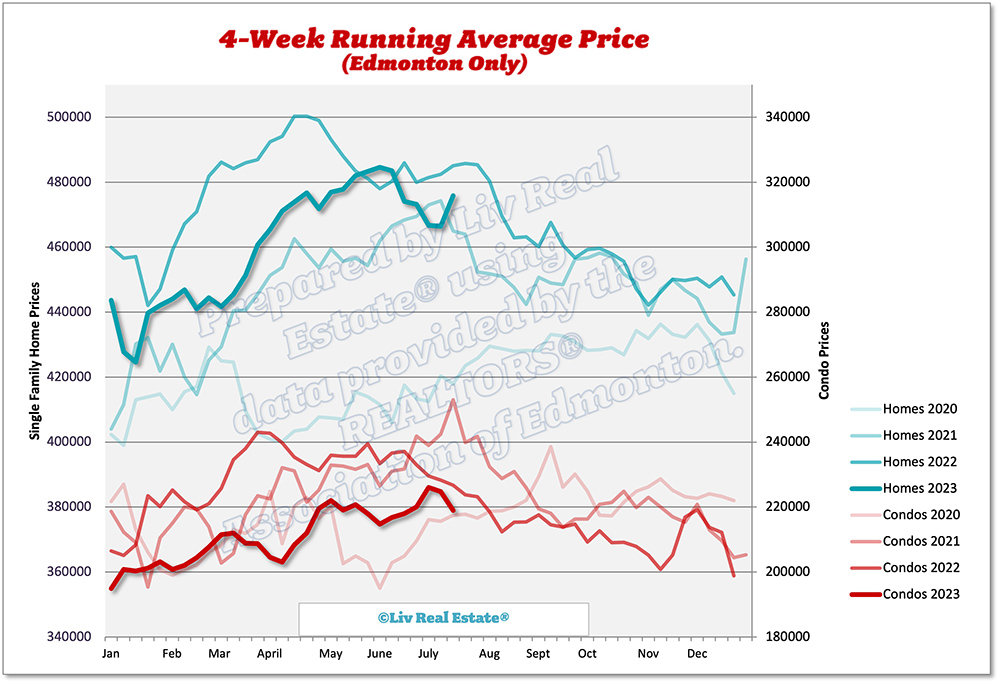
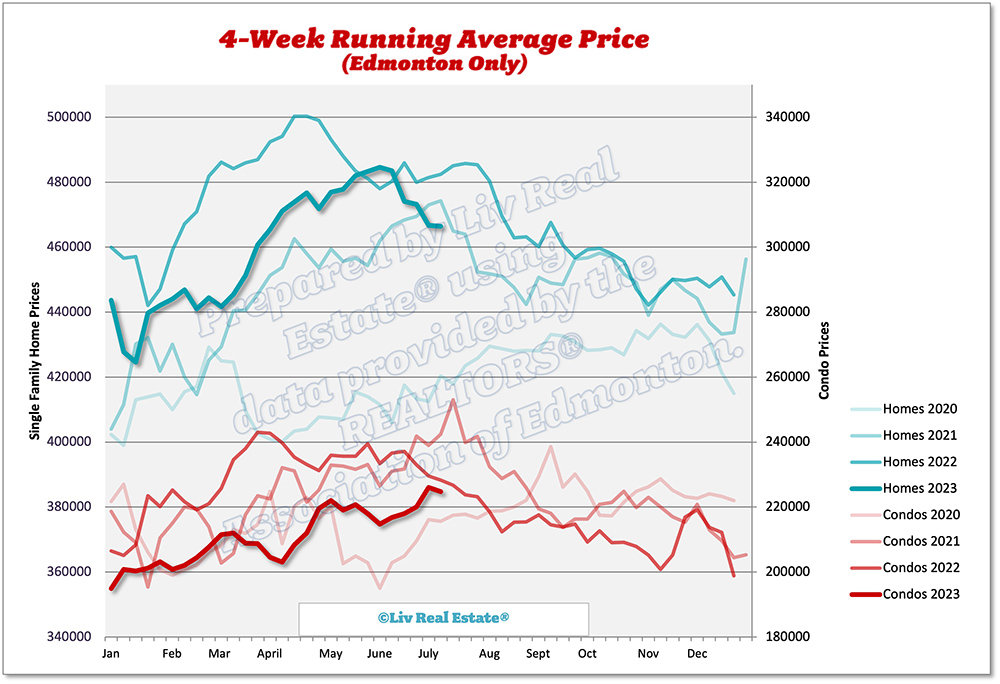
Active listings were down 16% from July 2022, while sales were up 18% leaving us in a strong seller's market. However, we aren't seeing the same spike in prices that you would expect from a seller's market due to the higher interest rates. In fact, the benchmark price for all categories was down compared to July 2022, with the composite down 6%. 


City of Edmonton Stats

Below are the statistics for Edmonton Proper, showing both single-family and condo sales at a high since 2015, when comparing July 2023 to July years previous.


405 Views, 0 Comments

Here is our update on the Edmonton real estate market. (Previous week’s numbers are in brackets). For the past 7 days:

New Listings: 503 (593, 543, 586)
Sales: 341 (374, 398, 457)
Ratio: 68% (63%, 72%, 78%)
Price Changes: 327 (387, 410, 393)
Expired/Off-Market Listings: 196 (356, 211, 240)
Net loss/gain in listings this week: -34 (-137, -57, -111)
Active single-family home listings: 2942 (2925, 2952, 2942)
Active condo listings: 1811 (1840, 1885, 1873)
Homes 4-week running average: $480 ($477, $474, $476)
Condos 4-week running average: $217 ($215, $222, $219)

405 Views, 0 Comments

Here is our update on the Edmonton real estate market. (Previous week’s numbers are in brackets). For the past 7 days:

New Listings: 593 (543, 586, 664)
Sales: 374 (398, 457, 432)
Ratio: 63% (72%, 78%, 65%)
Price Changes: 387 (410, 393, 418)
Expired/Off-Market Listings: 356 (211, 240, 243)
Net loss/gain in listings this week: -137 (-57, -111, -11)
Active single-family home listings: 2925 (2952, 2942, 2941)
Active condo listings: 1840 (1885, 1873, 1888)
Homes 4-week running average: $477 ($474, $476, $466)
Condos 4-week running average: $215 ($222, $219, $225)

523 Views, 0 Comments

Here is our update on the Edmonton real estate market. (Previous week’s numbers are in brackets). For the past 7 days:

New Listings: 543 (586, 664, 602)
Sales: 398 (457, 432, 379)
Ratio: 72% (78%, 65%, 63%)
Price Changes: 410 (393, 418, 371)
Expired/Off-Market Listings: 211 (240, 243, 395)
Net loss/gain in listings this week: -57 (-111, -11, -172)
Active single-family home listings: 2952 (2942, 2941, 2905)
Active condo listings: 1885 (1873, 1888, 1877)
Homes 4-week running average: $474 ($476, $466, $467)
Condos 4-week running average: $222 ($219, $225, $226)


583 Views, 0 Comments

Here is our update on the Edmonton real estate market. (Previous week’s numbers are in brackets). For the past 7 days:

New Listings: 586 (664, 602, 516)
Sales: 457 (432, 379, 411)
Ratio: 78% (65%, 63%, 80%)
Price Changes: 393 (418, 371, 398)
Expired/Off-Market Listings: 240 (243, 395, 179)
Net loss/gain in listings this week: -111 (-11, -172, -74)
Active single-family home listings: 2942 (2941, 2905, 2976)
Active condo listings: 1873 (1888, 1877, 1914)
Homes 4-week running average: $476 ($466, $467, $473)
Condos 4-week running average: $219 ($225, $226, $220)

610 Views, 2 Comments

Here is our update on the Edmonton real estate market. (Previous week’s numbers are in brackets). For the past 7 days:

New Listings: 664 (602, 516, 526)
Sales: 432 (379, 411, 430)
Ratio: 65% (63%, 80%, 82%)
Price Changes: 418 (371, 398, 344)
Expired/Off-Market Listings: 243 (395, 179, 203)
Net loss/gain in listings this week: -11 (-172, -74, -107)
Active single-family home listings: 2941 (2905, 2976, 2958)
Active condo listings: 1888 (1877, 1914, 1917)
Homes 4-week running average: $466 ($467, $473, $474)
Condos 4-week running average: $225 ($226, $220, $218)

565 Views, 0 Comments

Here is our update on the Edmonton real estate market. (Previous week’s numbers are in brackets). For the past 7 days:

New Listings: 602 (516, 526, 606)
Sales: 379 (411, 430, 433)
Ratio: 63% (80%, 82%, 71%)
Price Changes: 371 (398, 344, 403)
Expired/Off-Market Listings: 395 (179, 203, 179)
Net loss/gain in listings this week: -172 (-74, -107, -6)
Active single-family home listings: 2905 (2976, 2958, 2973)
Active condo listings: 1877 (1914, 1917, 1919)
Homes 4-week running average: $467 ($473, $474, $484)
Condos 4-week running average: $226 ($220, $218, $217)

561 Views, 2 Comments

Here's something we haven't said in a while... apartment-style condo sales took a major leap in June - they were up 26% from last June. Net migration to Alberta has reached new all-time highs, with almost 150,000 people moving to the province between June 2022 and March 2023. Approximately 2/3 of these new migrants are international, and this is creating very high demand for rental properties. As a result, there has been increased interest in condo-style apartments. Apartment prices have been on the decline for years in Edmonton, and although we're not seeing a year-over-year increase in the benchmark price yet, it does appear as though apartment prices may have bottomed out in January of this year. 

Listing inventory is now well below normal levels,…

938 Views, 0 Comments

Here is our update on the Edmonton real estate market. (Previous week’s numbers are in brackets). For the past 7 days:

New Listings: 516 (526, 606, 664)
Sales: 411 (430, 433, 425)
Ratio: 80% (82%, 71%, 64%)
Price Changes: 398 (344, 403, 415)
Expired/Off-Market Listings: 179 (203, 179, 198)
Net loss/gain in listings this week: -74 (-107, -6, 41)
Active single-family home listings: 2976 (2958, 2973, 2994)
Active condo listings: 1914 (1917, 1919, 1857)
Homes 4-week running average: $473 ($474, $484, $485)
Condos 4-week running average: $220 ($218, $217, $215)


568 Views, 1 Comments

Here is our update on the Edmonton real estate market. (Previous week’s numbers are in brackets). For the past 7 days:

New Listings: 526 (606, 664, 615)
Sales: 430 (433, 425, 413)
Ratio: 82% (71%, 64%, 67%)
Price Changes: 344 (403, 415, 459)
Expired/Off-Market Listings: 203 (179, 198, 331)
Net loss/gain in listings this week: -107 (-6, 41, -129)
Active single-family home listings: 2958 (2973, 2994, 2903)
Active condo listings: 1917 (1919, 1857, 1814)
Homes 4-week running average: $474 ($484, $485, $483)
Condos 4-week running average: $218 ($217, $215, $218)

590 Views, 2 Comments